
BMARK 2026-V24 is a $759.3 million five-year conduit CMBS transaction. We compare it with four recent five-year conduits: BMO 2026-5C16, BMARK 2026-V23, BANK5 2026-5YR24, and BBCMS 2026-5C43. Four themes stand out: overweights to retail and office alongside a sharp industrial underweight; loan-level underwriting that in some cases runs ahead of in-place cash flow; credit support below the senior classes that is thinner than peers, paired with wider spreads; and stress scenarios in which the office loans test the lower-rated bonds.
Composition and Credit
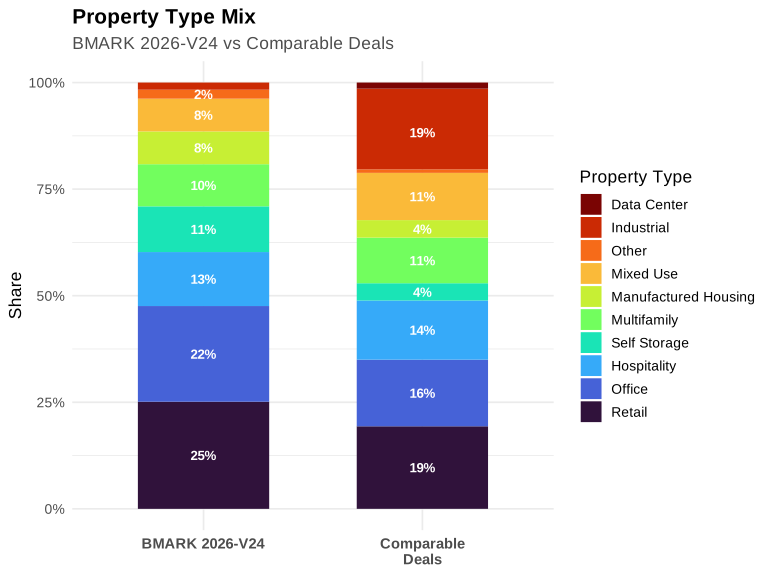
- Property types tilt to retail, office, self storage, and manufactured housing. Retail (25.1% versus 19.4% peer average) and office (22.4% versus 15.6%) are the two largest overweights; self storage (10.7% versus 4.1%) and manufactured housing (7.7% versus 4.1%) are also elevated. Industrial, at 1.7% versus 18.9%, is a significant underweight, while hospitality is roughly in line at 12.7% versus 13.9%.
- Geography concentrates in New York and several outlier states. New York is the largest state at 25.6%, slightly above the 22.0% peer average, while North Carolina (11.8% versus 1.9%), Florida (11.1% versus 4.8%), Washington, DC (9.9% versus 5.0%), and Tennessee (8.9% versus 0.3%) are all notably overweight. Texas (5.4% versus 10.4%) and California (3.1% versus 7.9%) are underweight.
State Allocations
| State | BMARK 2026-V24 | Comparable Deals | BMO 2026-5C16 | BMARK 2026-V23 | BANK5 2026-5YR24 | BBCMS 2026-5C43 |
|---|---|---|---|---|---|---|
| NY | 25.6% | 22.0% | 38.1% | 25.7% | 11.4% | 12.8% |
| NC | 11.8% | 1.9% | 0.5% | 5.6% | 0.0% | 1.6% |
| FL | 11.1% | 4.8% | 8.1% | 1.7% | 1.8% | 7.6% |
| DC | 9.9% | 5.0% | 4.5% | 3.9% | 8.6% | 3.0% |
| TN | 8.9% | 0.3% | 0.7% | 0.0% | 0.0% | 0.7% |
| TX | 5.4% | 10.4% | 1.6% | 12.5% | 8.5% | 19.1% |
| PA | 4.1% | 1.8% | 1.3% | 3.0% | 0.9% | 2.0% |
| Top 3 States | 48.5% | 47.9% | 55.6% | 48.4% | 38.3% | 49.3% |
- Concentration and IO metrics compare favorably. Top-ten concentration is slightly lower than peers (57.5% versus 60.9%), the full-term IO share of 80.7% is below the 87.1% peer average, and weighted average balloon LTV is in line at 41.8% versus 41.1%.
- Low-occupancy and low-coverage exposures are elevated. Loans with occupancy below 80% represent 19.9% of the pool versus 14.1% for peers, and loans with DSCR below 1.25x represent 6.3% versus 4.1%. Sponsor cash equity of 8.1% is below the 11.5% peer average, though no loans carry a debt yield below 8%. In-term tenant rollover is in line with peers: top-five tenants with leases expiring before loan maturity account for a balance-weighted 16.6% of NRA, versus a 15.6% peer average.
Credit Metrics
| Metric | BMARK 2026-V24 | Comparable Deals | BMO 2026-5C16 | BMARK 2026-V23 | BANK5 2026-5YR24 | BBCMS 2026-5C43 |
|---|---|---|---|---|---|---|
| Top 10 Loans Share of Deal | 57.5% | 60.9% | 66.0% | 64.8% | 57.0% | 55.8% |
| Largest Sponsor Share of Deal | 9.9% | 9.9% | 9.9% | 9.9% | 10.0% | 9.8% |
| Effective Loan Count | 21.1 | 19.9 | 17.4 | 18.6 | 21.6 | 22.2 |
| Full Term IO Share of Deal | 80.7% | 87.1% | 97.7% | 81.8% | 87.3% | 81.8% |
| Partial IO Share of Deal | 0.0% | 1.5% | 0.0% | 0.0% | 6.0% | 0.0% |
| Wtd Avg Balloon LTV | 41.8% | 41.1% | 37.8% | 39.9% | 42.6% | 43.9% |
| Wtd Avg Subordinated Debt Gap Pct | 0.2% | 0.4% | 1.7% | 0.0% | 0.0% | 0.0% |
| Non-Controlling Share of Deal | 16.5% | 27.6% | 50.7% | 28.6% | 13.5% | 17.6% |
| DSCR Under 1.25 Share of Deal | 6.3% | 4.1% | 0.0% | 10.9% | 2.9% | 2.6% |
| Occupancy Under 80 Pct Share of Deal | 19.9% | 14.1% | 11.9% | 11.0% | 14.8% | 18.7% |
| Debt Yield Under 8 Pct Share of Deal | 0.0% | 0.4% | 0.0% | 1.0% | 0.7% | 0.0% |
| Sponsor Cash Equity Pct | 8.1% | 11.5% | 6.5% | 10.1% | 12.0% | 17.6% |
| Wtd Avg Top-5 Tenant NRA Expiring Before Maturity | 16.6% | 15.6% | 20.8% | 3.7% | 21.2% | 16.8% |
Loan-Level Review
- Loan 3 (Compass Storage National Portfolio 2.0 - self storage): underwriting runs ahead of in-place cash flow. Underwritten NOI is about 7.9% above trailing-twelve-month results, helped by an insurance assumption below the historical run-rate. On in-place cash flow, whole-loan DSCR is 1.43x (1.54x underwritten) and debt yield is 8.8% (9.5% underwritten). The loan is full-term IO with 62.7% LTV at maturity on a 5.73% cap-rate valuation. The 1.15x cash-sweep trigger sits roughly 25% below underwritten coverage (about 20% below in-place). Two of the 16 properties carry environmental conditions of record. The portfolio spans nine states with no property above roughly 10% of NOI, the sponsor contributed 10.0% of sources as new equity, and additional debt is prohibited.
- Loan 6 (University Park - suburban office): in-term rollover inside a full-term IO loan. Just over half of NRA and nearly two-thirds of underwritten base rent roll through 2031, the year the loan matures. Three tenants hold termination options, none large enough to trip the 10% NRA sweep threshold. Underwritten NOI depends on rent abatements burning off, and occupancy of 78.4% is 6.0 points below the submarket (no lease-up is assumed). DSCR is 1.64x underwritten and 1.57x trailing against a 1.40x trigger, and LTV is 58.1% at cut-off and maturity. The rent roll is granular (49 tenants, the largest at 7.1% of NRA), TI/LC and abatement reserves are funded upfront and ongoing, and the refinance returned no equity.
- Loan 7 (Hager NYC Portfolio - multifamily/mixed-use): coverage rests on a recent lease-up and unseasoned income. NCF DSCR was 0.77x in 2025 and 1.00x on a trailing-twelve-month basis, against 1.21x underwritten, which is only 0.06x above the 1.15x trigger for the springing lockbox and cash management. Nearly half of residential income comes from third-party short-term-rental operators, and retail is more than a quarter of underwritten revenue. A meaningful share of units are rent-regulated, which limits how much of the gap to market rents can be captured. The loan is a full-term IO cash-out refinance with no new sponsor equity and 71.8% LTV at maturity. The renovated 753 9th Avenue property is fully leased (93.3% across the portfolio), submarket vacancy is 2.2%, and additional debt is not permitted.
- Loan 15 (Marriott Cincinnati Northeast - full-service hotel): rate-driven performance and an aging renovation. Revenue is underwritten to trailing actuals, giving an NCF DSCR of 1.84x (historical low 1.51x) at 59.8% cut-off LTV, and the loan amortizes on a 30-year schedule. RevPAR penetration of 113.0% comes entirely from rate (137.3% ADR penetration). Occupancy trails the competitive set, whose own occupancy is trending down. Roughly 29% of proceeds were cashed out, the PIP reserve is springing only, the last renovation was in 2017, and about 14% of appraised value is personal property.
Structure and Relative Value
- Senior classes: peer-level subordination with a spread pickup. Senior credit support of 30.00% matches the 30.00% comp average, yet the A-1 and A-3 price 8 to 10 bps wider — additional spread at equal enhancement.
- A-S: a thinner cushion, explicitly priced. Credit support of 18.62% sits 213 bps below the 20.75% comp average, while the 120 bps spread sits 12 bps above the 108 bps comp average. The market appears to be charging a concession for the thinner cushion rather than treating the collateral as warranting less enhancement.
- B: lowest support in the set, tied for the widest spread. Credit support of 13.75% is 241 bps below the 16.16% comp average — the lowest alongside BANK5 2026-5YR24 — at 150 bps versus 135 bps (+15 bps).
- C: the thinnest cushion among A- rated classes, and the widest concession. Credit support of 10.12% is 191 bps below the 12.03% comp average, at 225 bps versus 197 bps (+28 bps). The market reading could be that the thinner cushion has been priced in.
Deal Structure and Pricing
| Class | BMARK 2026-V24 Credit Support | Comparable CS | Diff CS (bps) | BMARK 2026-V24 Spread | Comparable Spread | Diff Spread (bps) |
|---|---|---|---|---|---|---|
| A-1 | 30.00% | 30.00% | 0 | +85 | +77 | 8 |
| A-3 | 30.00% | 30.00% | 0 | +93 | +83 | 10 |
| A-S | 18.62% | 20.75% | -213 | +120 | +108 | 12 |
| B | 13.75% | 16.16% | -241 | +150 | +135 | 15 |
| C | 10.12% | 12.03% | -191 | +225 | +197 | 28 |
- Split ratings at E, F-RR, and X-B merit attention. Class E carries a one-notch split (Fitch BB-sf versus KBRA BB(sf)) and F-RR a two-notch split (Fitch B-sf versus KBRA B+(sf)); as discussed below, the stress results align with the lower Fitch grades in both cases, and F-RR, as a risk-retention class, sits outside the placed relative-value set. X-B carries the widest divergence in the deal at six notches (Fitch A-sf versus KBRA AAA(sf)); all placed P&I classes through C remain money-good under both of our scenarios, so the referenced notional is not credit-impaired in these runs, though IO buyers weighing the KBRA view still face prepayment and extension sensitivity.
Stress Resilience
We ran the deal through Financialyst's cashflow model, which supports bespoke, user-driven scenarios — here, a targeted office extension-and-default stress built around the pool's office concentration — alongside a standard pool-wide CDR/severity run.
- Office scenario: the office book alone pushes losses to the edge of investment grade. Applying 24-month maturity extensions, a 35% post-maturity CDR and 55% loss severity to the seven office loans produces a 12.79% cumulative pool default rate and a 7.03% cumulative loss. Losses reach Class E (-1.78 points of headroom), F-RR and G-RR are wiped out, and Class D survives with only 0.09 points — effectively on the boundary. Among placed classes, C keeps 3.09 points, B 6.72, A-S 11.59, and the seniors 22.97.
- Moderate pool-wide stress: the thinner lower stack, more than unusual collateral weakness, drives the impairment. A 3% annual CDR at 40% severity produces a 13.52% cumulative default rate and a 5.41% cumulative loss. E is breached only marginally (-0.16 points) while D holds 1.71 points; C keeps 4.71, B 8.34, A-S 13.21, and the seniors 24.59. With peer-average subordination — D averages 9.12% versus the subject's 7.12%, and E 7.78% versus 5.25% — E would have remained whole in this run.
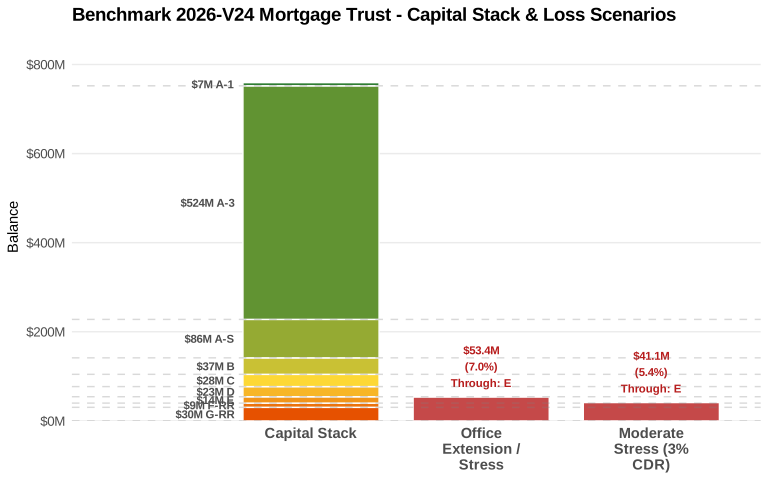
- Implications across the stack. Placed classes A-1 through C remain money-good in both scenarios, which supports reading the wide spreads as compensation rather than an unpriced risk; C offers the largest spread pickup but the narrowest placed-class cushion under the office scenario, and D's protection depends heavily on how the seven office loans resolve at maturity. The impairment of E in both runs sits closer to Fitch's BB-sf than KBRA's BB(sf), a point buyers leaning on the higher grade may want to weigh, and F-RR's full write-down in both runs is consistent with the lower of its two grades.
Conclusion
BMARK 2026-V24 pairs overweights to retail, office, self storage, and manufactured housing, and elevated low-occupancy and low-coverage exposure, with credit support that is thinner than peers at each class from A-S down and spreads that are wider for the placed classes. At the loan level, the main items to watch are underwriting that runs ahead of in-place cash flow (the Hager NYC Portfolio and the Compass self-storage portfolio) and in-term office rollover at University Park. In our stress runs, the placed classes through C keep positive headroom, losses reach Class E in both scenarios, and Class D sits at the boundary in the office scenario. The wider spreads on A-S through C look like explicit compensation for the thinner enhancement; whether that compensation is enough depends on each investor's view of how the seven office loans resolve at maturity.
Important Disclaimers & Disclosures
Nature of Content: This publication is for informational purposes only and is intended solely for sophisticated institutional investors. The content herein, including credit analyses, relative value assessments, and structural reviews, constitutes statements of opinion as of the date of publication and not statements of fact regarding creditworthiness or investment potential. Nothing contained in this report constitutes investment advice, a recommendation, or an offer to sell or a solicitation of an offer to buy any securities. This report does not take into account the particular investment objectives, financial situations, or needs of individual investors.
Data Integrity & Sources: The data and information contained herein are derived from the Preliminary Prospectus and other sources believed by Financialyst, Inc. to be reliable. However, Financialyst, Inc. has not performed an independent audit or verification of the underlying collateral data (including Annex A data tapes). This information is provided on an "as-is" basis and is subject to amendment or supplementation. Financialyst, Inc. makes no representation or warranty, express or implied, regarding the accuracy, timeliness, completeness, merchantability, or fitness for a particular purpose of any such information.
Limitation of Liability: Financialyst, Inc. and its directors, officers, employees, and agents specifically disclaim any and all liability for any errors, omissions, or delays in the data or analysis, or for any actions taken in reliance thereon. In no event shall Financialyst, Inc. be liable for any direct, indirect, incidental, special, or consequential damages arising out of the use of, or inability to use, this report or the information contained herein, even if advised of the possibility of such damages.
Forward-Looking Statements: This report may contain forward-looking statements regarding future market conditions, lease expirations, or asset performance. These statements are based on current assumptions and are subject to risks and uncertainties; actual results may differ materially. Financialyst, Inc. assumes no obligation to update any information or opinions contained herein.
Copyright: © 2026 Financialyst, Inc. All Rights Reserved. This publication may not be reproduced, retransmitted, or distributed in any form without the prior written consent of Financialyst, Inc.