
BBCMS 2026-M1 is the third multifamily conduit securitization of 2026, with a collateral composition that pairs a core of apartment properties with a manufactured-housing component not found in the two previous multifamily deals. We compare the transaction against the other two recent multifamily deals, CGCMT 2026-MFAM1 and NATIXIS 2026-M1. Four themes run through the analysis: a geographically idiosyncratic pool, credit metrics that are generally stronger than peers alongside a few points of divergence, mezzanine subordination that is thinner than the comps at pricing close to the tightest of them, and a deeper retained junior stack whose loss-absorbing capacity we test with a bespoke New York-metro stress. Financialyst's cashflow model was used to analyze two stress scenarios and their impact on bond performance.
Composition and Credit
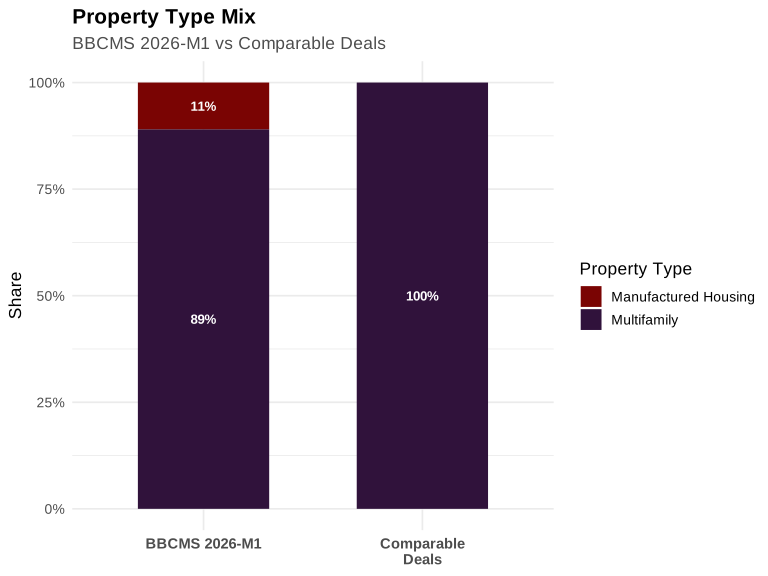
- Property-type mix includes manufactured housing, in contrast to the multifamily comps. The pool is 89.0% multifamily and 11.0% manufactured housing; both peer deals are 100% multifamily, making the manufactured-housing exposure unique to this transaction.
- Geography is concentrated and idiosyncratic. New York is 29.4% of the pool and California 18.5%, running 11.5 and 10.1 percentage points above peer averages, respectively. The pool also holds meaningful exposure to Wisconsin (8.5%), Virginia (8.3%), and Ohio (7.2%) — states absent from the comps — while carrying zero exposure to Texas (14.3% peer average), Pennsylvania (5.3%), and Georgia (5.0%). The result is a less diversified, more idiosyncratic geographic footprint than peers.
State Allocations
| State | BBCMS 2026-M1 | Comparable Deals | CGCMT 2026-MFAM1 | NATIXIS 2026-M1 |
|---|---|---|---|---|
| NY | 29.4% | 17.9% | 21.2% | 14.5% |
| CA | 18.5% | 8.4% | 16.8% | 0.0% |
| WI | 8.5% | 0.0% | 0.0% | 0.0% |
| VA | 8.3% | 0.0% | 0.0% | 0.0% |
| OH | 7.2% | 2.4% | 0.0% | 4.8% |
| FL | 6.6% | 12.9% | 14.2% | 11.6% |
| ID | 3.6% | 0.0% | 0.0% | 0.0% |
| Top 3 States | 56.4% | 50.4% | 52.2% | 48.7% |
- Credit metrics are generally stronger than the peer averages. Weighted average balloon LTV of 58.5% is 11.2 points below the 69.7% peer average; the share of loans with debt yield under 8% is 35.6% versus 75.5%; the DSCR-under-1.25x share is 41.1% versus 53.0%; and top-10 concentration of 49.7% versus 61.5% indicates better credit diversification.
- Two areas of divergence warrant attention. The pool carries an 11.9% non-controlling note share where the comps carry none — a governance consideration that resurfaces at the loan level — and sponsor cash equity is low at 0.79% versus the 3.36% peer average.
Credit Metrics
| Metric | BBCMS 2026-M1 | Comparable Deals | CGCMT 2026-MFAM1 | NATIXIS 2026-M1 |
|---|---|---|---|---|
| Top 10 Loans Share of Deal | 49.7% | 61.5% | 57.8% | 65.2% |
| Largest Sponsor Share of Deal | 8.5% | 10.2% | 8.5% | 11.9% |
| Effective Loan Count | 26.6 | 19.5 | 21.5 | 17.5 |
| Full Term IO Share of Deal | 100.0% | 100.0% | 100.0% | 100.0% |
| Partial IO Share of Deal | 0.0% | 0.0% | 0.0% | 0.0% |
| Wtd Avg Balloon LTV Share of Deal | 58.5% | 69.7% | 69.0% | 70.3% |
| Wtd Avg Subordinated Debt Gap Pct Share of Deal | 0.0% | 0.0% | 0.0% | 0.0% |
| Non-Controlling Share of Deal | 11.9% | 0.0% | 0.0% | 0.0% |
| DSCR Under 1.25 Share of Deal | 41.1% | 53.0% | 46.5% | 59.5% |
| Occupancy Under 80 Pct Share of Deal | 0.0% | 0.0% | 0.0% | 0.0% |
| Debt Yield Under 8 Pct Share of Deal | 35.6% | 75.5% | 83.8% | 67.2% |
| Sponsor Cash Equity Pct, Share of Deal | 0.8% | 3.4% | 0.9% | 5.8% |
Loan-level Review
We thought three loans warranted a closer look.
- Loan 1 (Franklin 8 Pack, manufactured housing portfolio): a cash-out, full-term interest-only refinance offset by a long and stable operating history. The whole loan exceeds the sponsor's combined purchase price for the portfolio, and the 1.29x DSCR and 8.2% debt yield are supported by a rate buydown, with underwriting modestly above trailing NOI and below trailing expenses. Against that, NOI has grown in each period since 2023, weighted occupancy has held near 98% since 2021, cut-off and maturity LTV are both 65.5%, and no mezzanine debt or partial releases are permitted. The sponsor is a long-tenured operator — reportedly the largest manufactured-housing owner in Virginia — the trust holds the controlling note, and the cash-trap trigger sits 0.14x below underwritten coverage.
- Loan 6 (Edison Grand): coverage rests on projected cash flow, and the trust holds the non-controlling note. Underwritten NOI runs roughly 65% above the only available historical result (the property was renovated through 2026), trailing cash flow implies coverage of roughly 0.75x on whole-loan debt service, and the 1.20x underwritten DSCR is also supported by a rate buydown. Several assumptions sit on the favorable side — vacancy underwritten 8.7 points below the submarket, insurance below trailing levels, a tax rebate contingent on actual increment revenues, and a commercial anchor contributing a meaningful share of underwritten income that has not yet taken occupancy. The controlling note sits in a peer transaction that services the loan, the 1.10x DSCR trigger is only 0.10x below underwriting and can be deferred by posting collateral.
- Loan 15 (Unbridled Living of Columbia): low leverage and an earnout structure cushion a senior-housing asset whose occupancy-improvement plan is underway. The sponsor acquired the property in 2025 with no operator track record provided, food services account for a quarter of income, and occupancy has held near 80% — below the 85–100% range of newer competing properties — while the loan returns equity with no new sponsor cash. Underwriting is essentially at in-place levels rather than assuming lease-up, leverage is 55.0% at cut-off and maturity (full-term interest-only), and a planned renovation is fully reserved. An earnout holdback is released only in increments against rising occupancy, revenue, debt-yield, and coverage tests, keeping the effective net debt yield near 11.5% versus the 9.5% headline until performance improves — a cushion for the credit, while the renovation proceeds.
Structure, Governance, and Relative Value
- Senior AAAs match peer subordination with pricing inside the comp averages. A-2 and A-3 carry 30.00% credit support, identical to peers, and price at 77 bps and 79 bps — 9.5 bps inside the 86.5/88.5 bps comp averages, though those averages are pulled wide by NATIXIS (95/97 bps); against CGCMT (78/80 bps) the subject is essentially flat.
- A-S carries thinner support for little additional spread. Credit support of 21.62% versus a 24.38% peer average (275 bps less, the lowest in the set) prices at 110 bps — 12.5 bps inside the average but only 5 bps wide of CGCMT's 105 bps, where support is 24.12%. Investors receive roughly 2.5 to 3 points less structural cushion for little or no extra compensation. The pricing could be viewed as the market underwriting the collateral as needing less enhancement.
- Class B shows the largest subordination shortfall in the placed stack. Support of 16.12% versus a 19.31% peer average (319 bps less) prices at 130 bps — 30 bps inside the average, though that gap reflects NATIXIS at 190 bps; against CGCMT, B prints flat at 130 bps despite 200 bps less support. The class is split-rated Fitch AA-sf versus DBRS AAA(sf), a three-notch divergence: investors who weight DBRS see AAA-type risk at a mezzanine spread, while Fitch-constrained buyers will treat the class as AA- with thinner protection than peers.
- Class C subordination is the lowest of the set, with no spread available to assess. Support of 11.88% versus a 14.44% peer average (256 bps less) accompanies a four-notch split — Fitch A-sf versus DBRS AA(sf).
- Class E's split bears on investment-grade eligibility. Support of 8.50% sits near the 8.75% peer average, but the Fitch BBB-sf versus DBRS A(sf) four-notch divergence places the class at the investment-grade boundary for buyers who weight the Fitch view, which may affect eligibility for IG-constrained mandates.
Deal Structure and Pricing
| Class | BBCMS 2026-M1 Credit Support | Comparable CS | CS (bps) | BBCMS 2026-M1 Spread | Comparable Spread | Spread (bps) | Split |
|---|---|---|---|---|---|---|---|
| A-2 | 30.00% | 30.00% | 0 | +77 | +86.50 | -10 | — |
| A-3 | 30.00% | 30.00% | 0 | +79 | +88.50 | -10 | — |
| A-S | 21.62% | 24.38% | -275 | +110 | +122.50 | -12 | — |
| B | 16.12% | 19.31% | -319 | +130 | +160.00 | -30 | 3-notch |
- The retained junior stack is deeper than peers. G-RR carries 4.88% support versus 3.81%, J-RR 2.88% versus a 0.00% peer average, with additional K-RR and L-RR tranches below — an extra layer of loss absorption beneath the placed classes that the stress scenarios test directly.
Stress Resilience
We ran the deal through Financialyst's cashflow model, which runs bespoke, user-driven scenarios — here, a New York-metro multifamily shock designed around the pool's largest geographic concentration — alongside standard pool-wide stresses, so investors can test the deal against their own views of concentration risk.
- NY-metro multifamily shock: losses land in the retained layers. Applying a 12% default rate at 50% loss severity to NY-metro properties produces an 11.71% cumulative default rate and a 5.85% cumulative pool loss. J-RR, K-RR, and L-RR are written off and G-RR is partially impaired (0.97 points below the loss); F is the lowest money-good class at 1.65 points of headroom. All placed classes remain protected: B retains 10.27 points, A-S 15.77, and the senior AAAs 24.15 — the New York concentration identified in the pool composition is absorbed within the risk-retention and below-IG layers.
- Moderate pool-wide stress: a similar outcome. A 3% annual default rate at 40% severity applied across the collateral produces a 13.87% cumulative default rate and a 5.55% cumulative loss. First loss again reaches G-RR (0.67 points below), F stays money-good at 1.95 points, and placed-class headroom is marginally higher — B 10.57, A-S 16.07, and the senior AAAs 24.45. The similarity of the two outcomes reflects the thick retained junior stack absorbing moderate losses regardless of whether the stress is regional or broad-based.
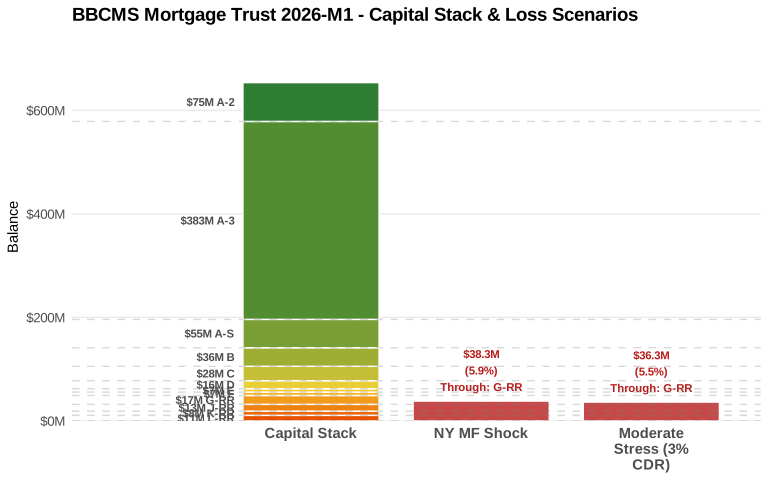
- Implication for the mezzanine classes. No placed class is breached in either scenario, and the thinnest placed cushion — Class B at roughly 10.3 points — remains intact. Investors with more severe loss assumptions may weigh the subordination sizing differently.
Conclusion
BBCMS 2026-M1 is a multifamily conduit deal with a distinct collateral profile — a manufactured-housing component not found in the comps, concentrated New York and California exposure, and states absent from the peer set — balanced by generally strong credit metrics, including lower balloon leverage, a smaller share of low-debt-yield loans, and increased top-10 diversification. At the bond level, mezzanine buyers accept subordination 256 to 319 bps below peer averages at pricing essentially flat to the tightest comp. Set against this, the retained junior stack is deeper than peers and absorbs both tested stresses entirely below the placed classes, with headroom ranging from roughly 10 points at Class B to more than 24 at the senior AAAs. Investors with harsher regional or pool-wide loss assumptions will want to weigh the mezzanine subordination sizing accordingly.
Important Disclaimers & Disclosures
Nature of Content: This publication is for informational purposes only and is intended solely for sophisticated institutional investors. The content herein, including credit analyses, relative value assessments, and structural reviews, constitutes statements of opinion as of the date of publication and not statements of fact regarding creditworthiness or investment potential. Nothing contained in this report constitutes investment advice, a recommendation, or an offer to sell or a solicitation of an offer to buy any securities. This report does not take into account the particular investment objectives, financial situations, or needs of individual investors.
Data Integrity & Sources: The data and information contained herein are derived from the Preliminary Prospectus and other sources believed by Financialyst, Inc. to be reliable. However, Financialyst, Inc. has not performed an independent audit or verification of the underlying collateral data (including Annex A data tapes). This information is provided on an "as-is" basis and is subject to amendment or supplementation. Financialyst, Inc. makes no representation or warranty, express or implied, regarding the accuracy, timeliness, completeness, merchantability, or fitness for a particular purpose of any such information.
Limitation of Liability: Financialyst, Inc. and its directors, officers, employees, and agents specifically disclaim any and all liability for any errors, omissions, or delays in the data or analysis, or for any actions taken in reliance thereon. In no event shall Financialyst, Inc. be liable for any direct, indirect, incidental, special, or consequential damages arising out of the use of, or inability to use, this report or the information contained herein, even if advised of the possibility of such damages.
Forward-Looking Statements: This report may contain forward-looking statements regarding future market conditions, lease expirations, or asset performance. These statements are based on current assumptions and are subject to risks and uncertainties; actual results may differ materially. Financialyst, Inc. assumes no obligation to update any information or opinions contained herein.
Copyright: © 2026 Financialyst, Inc. All Rights Reserved. This publication may not be reproduced, retransmitted, or distributed in any form without the prior written consent of Financialyst, Inc.