
BBCMS 2026-5C43 is a five-year conduit, which we compare to three recent five-year peers: BMO 2026-5C16, BMARK 2026-V23, and BANK5 2026-5YR24. Four themes stand out: a collateral tilt toward retail and hospitality, with heavy Texas and California exposure; elevated tenant-roll and low-occupancy exposure, partly offset by better diversification and more sponsor equity; thinner-than-peer subordination from A-S down, priced differently class by class; and split ratings in the lower stack, which our stress results help put in context.
Composition and Credit
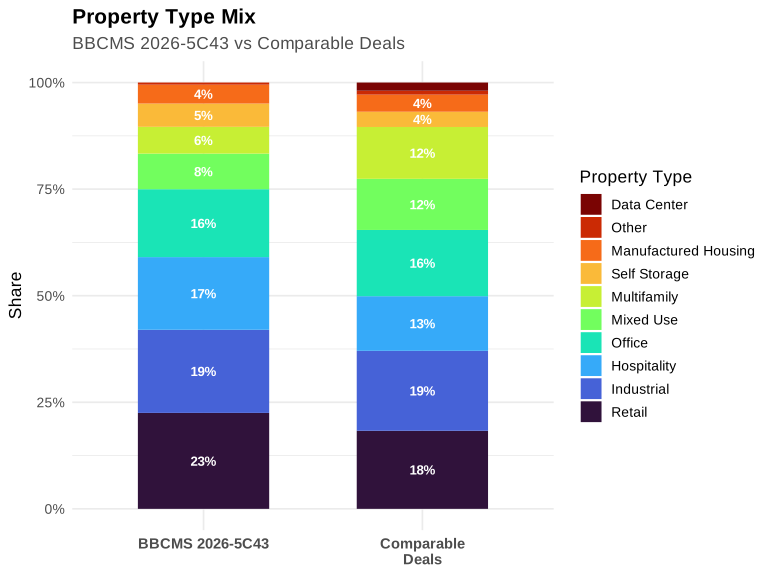
- Property-type mix tilts to retail and hospitality. The pool is overweight retail (22.5% versus 18.4% peer average) and hospitality (17.1% versus 13.0%), and notably underweight multifamily (6.3% versus 12.3%). Industrial exposure (19.5%) is roughly in line, and office (15.9%) sits just above the 15.7% peer average. The hospitality concentration - six hotel loans - becomes the focus of the loan-level stress scenario discussed below.
- Geography concentrates in Texas and California. Texas represents 19.1% of the pool versus a 7.6% peer average, and California 17.4% versus 4.7%. New York exposure (12.8%) is materially below the 25.1% peer average. Oregon (9.8%) is an outlier not prevalent in the comparable deals.
State Allocations
| State | BBCMS 2026-5C43 | Comparable Deals | BMO 2026-5C16 | BMARK 2026-V23 | BANK5 2026-5YR24 |
|---|---|---|---|---|---|
| TX | 19.1% | 7.6% | 1.6% | 12.5% | 8.5% |
| CA | 17.4% | 4.7% | 6.5% | 0.0% | 7.6% |
| NY | 12.8% | 25.1% | 38.1% | 25.7% | 11.4% |
| OR | 9.8% | 1.0% | 0.0% | 3.0% | 0.0% |
| FL | 7.6% | 3.8% | 8.1% | 1.7% | 1.8% |
| SC | 5.9% | 1.3% | 2.4% | 1.1% | 0.4% |
| GA | 3.6% | 0.7% | 0.6% | 0.5% | 1.2% |
| Top 3 States | 49.3% | 47.4% | 55.6% | 48.4% | 38.3% |
- Credit metrics offer offsets alongside concentrations of their own. Top-ten concentration is lower than peers (55.8% versus 62.6%), full-term IO share is lower (81.8% versus 88.9%), and sponsor cash equity is higher (17.6% versus 9.5%). Against that, the share of loans with occupancy below 80% is elevated (18.7% versus 12.6%), and tenant roll risk is the most noticeable divergence at 31.7% versus a 5.8% peer average. DSCR and debt yield metrics are generally in line with or slightly better than peers.
Credit Metrics
| Metric | BBCMS 2026-5C43 | Comparable Deals | BMO 2026-5C16 | BMARK 2026-V23 | BANK5 2026-5YR24 |
|---|---|---|---|---|---|
| Top 10 Loans Share of Deal | 55.8% | 62.6% | 66.0% | 64.8% | 57.0% |
| Largest Sponsor Share of Deal | 9.8% | 9.9% | 9.9% | 9.9% | 10.0% |
| Effective Loan Count | 22.2 | 19.2 | 17.4 | 18.6 | 21.6 |
| Full Term IO Share of Deal | 81.8% | 88.9% | 97.7% | 81.8% | 87.3% |
| Partial IO Share of Deal | 0.0% | 2.0% | 0.0% | 0.0% | 6.0% |
| Wtd Avg Balloon LTV | 43.9% | 40.1% | 37.8% | 39.9% | 42.6% |
| Wtd Avg Subordinated Debt Gap Pct | 0.0% | 0.6% | 1.7% | 0.0% | 0.0% |
| Non-Controlling Share of Deal | 17.6% | 30.9% | 50.7% | 28.6% | 13.5% |
| DSCR Under 1.25 Share of Deal | 2.6% | 4.6% | 0.0% | 10.9% | 2.9% |
| Occupancy Under 80 Pct Share of Deal | 18.7% | 12.6% | 11.9% | 11.0% | 14.8% |
| Debt Yield Under 8 Pct Share of Deal | 0.0% | 0.6% | 0.0% | 1.0% | 0.7% |
| Sponsor Cash Equity Pct Share of Deal | 17.6% | 9.5% | 6.5% | 10.1% | 12.0% |
| Tenant Roll Risk Share of Deal | 31.7% | 5.8% | 17.5% | 0.0% | 0.0% |
Loan-level Review
-
Loan 3 (111 Congress - CBD office): strong in-place cash flow against a concentrated rollover wall. A full-term IO structure leaves maturity LTV unchanged at 67.2%, against a 2028 expiration cluster of roughly 30% of underwritten rent (including a termination option) in a CBD submarket with 20.5% vacancy; cumulatively about 65% of space rolls through 2030, ahead of the 2031 maturity. Risk mitigants include an arm's-length acquisition with roughly 36% sponsor cash equity, an appraisal only modestly above the purchase price, a 14.7% underwritten debt yield and 2.03x DSCR, front-loaded leasing reserves, and a capped cash sweep tied to the largest tenant's renewal. The residual concern is that the sweep accrues only if excess cash is available and may underfund re-tenanting of multiple 2028 vacancies, while recent occupancy gains are short-tenured and refinance depends on sustaining the appraisal's 8.5% cap-rate value.
-
Loan 4 (Hilton Beachfront Resort & Spa Hilton Head Island - resort hotel): a persistent competitive gap, but conservatively underwritten and structured. The property is underperforming its comp set more than two years after a renovation and brand conversion, penetrating at roughly 81% on occupancy and 63% on RevPAR. Underwriting assumes no uplift - occupancy, rate, and revenue are set at trailing actuals - and trailing NOI has recovered each year since the conversion, with rooms only 59.2% of revenue in a market where low occupancy is a seasonal, market-wide pattern. Structure adds a seasonality reserve covering winter debt service, a hard lockbox, a 1.25x cash trap well below the 1.94x underwritten DSCR, and low leverage at 42.9% cut-off and 40.5% maturity LTV.
-
Loan 5 (GBP Industrial Portfolio - industrial/office): exit leverage and rollover concerns. The loan is full-term interest-only with a 69.3% maturity LTV, and it is a cash-out refinance that returned roughly 31% of proceeds to the sponsor, leaving no cash equity. In-place cash flow supports about 1.22x NCF DSCR versus 1.34x underwritten - the gap rests on rent steps, a gross-up of a dark property, and new leases - and roughly 87% of underwritten rent rolls by year-end 2031, including the largest tenant about six months before maturity, with a modest rollover reserve cap. A hard lockbox, a critical-tenant cash sweep starting twelve months before that lease's expiry, a 1.25x cash management trigger, and a 5% recourse guaranty provide some protection.
Structure and Relative Value
-
Senior AAAs sit at parity with a marginal pickup. A-1, A-2, and A-3 carry 30.00% credit support, identical to the comp average, and price 0-3bp wide of peers (A-1 preplaced; A-2 at 81bp versus 79bp; A-3 even at 83bp) - a small spread concession for equivalent structural protection.
-
A-S and B pair thinner subordination with tighter spreads. A-S carries 19.50% credit support versus a 21.38% comp average (188bp less) yet priced 5bp tighter at 105bp versus 110bp; B carries 14.75% versus 16.62% (187bp less) and priced 8bp tighter at 130bp versus 138bp. One reading is less structural protection for less compensation; the other is that buyers underwrite the collateral as needing less enhancement - and part of the A-S comparison is comp mix, since BANK5 printed the same 105bp on 18.25% support. The stress results below, where both classes retain large cushions, lean toward the collateral-quality reading, though investors might still want more compensation for the thinner cushion on a like-for-like basis.
-
Class C is the pricing exception. C carries 10.75% credit support versus a 12.46% comp average (171bp less), but unlike A-S and B the market charged for it: C printed at 210bp versus a 190bp comp average, 20bp wide and the widest in the set. Here investors are explicitly compensated for the thinner cushion, and with meaningful stress headroom the class could be viewed as a relative-value point rather than inadequate pay for risk.
-
Subordination runs thinner through the entire junior stack. D sits at 8.62% versus 9.29%, E at 7.62% versus 7.83%, F-RR at 5.62% versus 7.50%, and G-RR at 4.62% versus 5.62%. WALs are in line with peers (A-S 4.90 versus 4.97; B and C 4.96 versus 4.99), so the spread differences are not a duration artifact. The thinner cushions matter most at the bottom of the stack, where the stress scenarios actually bite.
-
Split ratings cluster in the lower stack. E is rated BBB-sf by Fitch versus BBB(sf) by KBRA (one notch); F-RR is BB-sf versus BB+(sf) and G-RR Bsf versus BB-(sf) (two notches each); and X-B carries the widest divergence at A-sf versus AAA(sf), six notches. Moody's does not rate these classes. For F-RR and G-RR in particular, the stress results below sit closer to Fitch's more conservative view.
Deal Structure and Pricing
| Class | BBCMS 2026-5C43 Credit Support | Comparable CS | CS diff (bps) | BBCMS 2026-5C43 Spread | Comparable Spread | Spread diff (bps) | Split |
|---|---|---|---|---|---|---|---|
| A-1 | 30.00% | 30.00% | 0 | (preplaced) | +77 | — | — |
| A-2 | 30.00% | 30.00% | 0 | +81 | +79 | 2 | — |
| A-3 | 30.00% | 30.00% | 0 | +83 | +83 | 0 | — |
| A-S | 19.50% | 21.38% | -188 | +105 | +110 | -5 | — |
| B | 14.75% | 16.62% | -187 | +130 | +138 | -8 | — |
| C | 10.75% | 12.46% | -171 | +210 | +190 | 20 | — |
Stress Resilience
We ran the deal through Financialyst's cashflow model under two scenarios: a bespoke loan-level lodging recession targeting the pool's six hotel loans - the hospitality concentration identified in the pool composition - and a standard moderate stress applied pool-wide. The model supports custom, user-driven stresses beyond standard pool-wide CDR/severity assumptions.
-
The lodging shock is absorbed entirely below the publicly-offered classes. Applying a 25% CDR and 50% loss severity to the six hospitality loans produces a 5.34% cumulative pool loss. First loss lands at G-RR (-0.72 percentage points of headroom) and J-RR is fully written down, while F-RR survives with just 0.28 points and E retains 2.28 points. All placed classes A-1 through C remain money-good with substantial cushions: C at +5.41 points, B at +9.41, A-S at +14.16, and the seniors at +24.66.
-
The moderate stress lands in the same place. A 3% applied CDR at 40% severity produces a 5.49% cumulative pool loss. G-RR again takes first loss (-0.87 points) and J-RR is written down; F-RR is the boundary class at only 0.13 points of headroom, with E at 2.13 points. Placed classes remain well protected: C +5.26, B +9.26, A-S +14.01, and the seniors +24.51.
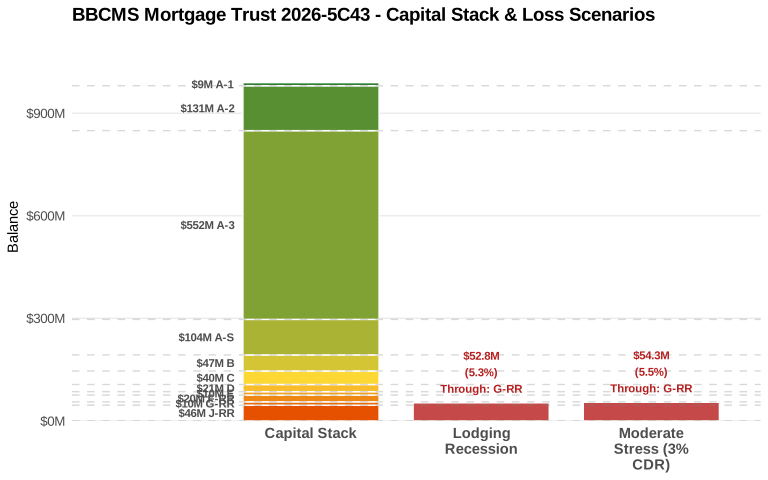
- The below-peer junior subordination determines where losses land. With F-RR at 5.62% support versus a 7.50% peer average and no additional first-loss tranche below J-RR, the loss boundary sits right at F-RR in both runs - essentially at the edge, with 0.13-0.28 points of headroom. G-RR is partially impaired in both scenarios - as a risk retention class this matters mainly for understanding where the boundary sits. For the X-B IO, the underlying classes retain positive cushions in both scenarios, so modeled cash flow is not threatened, but the Fitch A-sf grade is the binding constraint for ratings-sensitive holders.
Conclusion
BBCMS 2026-5C43 pairs a retail- and hospitality-heavy pool with Texas and California concentrations and elevated tenant-roll exposure, against better-than-peer diversification, less full-term IO, and more sponsor cash equity. At the loan level, the residual risk is at exit: two of the three loans reviewed are full-term IO with maturity LTVs in the high 60s and rollover concentrated ahead of maturity, risks that sweeps and reserves temper but do not resolve. In both stress runs, including the targeted lodging shock, losses stop at the retained G-RR and J-RR classes, with F-RR at the boundary and classes A-1 through C keeping wide cushions. On relative value, seniors get peer-level protection with a small pickup; A-S and B accept roughly 190bp less subordination at tighter spreads, a bet on collateral quality; and C is paid 20bp wide for a similar shortfall. The deal suits investors who share the market’s view of the collateral and whose downside case is no harsher than the scenarios modeled here.
Important Disclaimers & Disclosures
Nature of Content: This publication is for informational purposes only and is intended solely for sophisticated institutional investors. The content herein, including credit analyses, relative value assessments, and structural reviews, constitutes statements of opinion as of the date of publication and not statements of fact regarding creditworthiness or investment potential. Nothing contained in this report constitutes investment advice, a recommendation, or an offer to sell or a solicitation of an offer to buy any securities. This report does not take into account the particular investment objectives, financial situations, or needs of individual investors.
Data Integrity & Sources: The data and information contained herein are derived from the Preliminary Prospectus and other sources believed by Financialyst, Inc. to be reliable. However, Financialyst, Inc. has not performed an independent audit or verification of the underlying collateral data (including Annex A data tapes). This information is provided on an "as-is" basis and is subject to amendment or supplementation. Financialyst, Inc. makes no representation or warranty, express or implied, regarding the accuracy, timeliness, completeness, merchantability, or fitness for a particular purpose of any such information.
Limitation of Liability: Financialyst, Inc. and its directors, officers, employees, and agents specifically disclaim any and all liability for any errors, omissions, or delays in the data or analysis, or for any actions taken in reliance thereon. In no event shall Financialyst, Inc. be liable for any direct, indirect, incidental, special, or consequential damages arising out of the use of, or inability to use, this report or the information contained herein, even if advised of the possibility of such damages.
Forward-Looking Statements: This report may contain forward-looking statements regarding future market conditions, lease expirations, or asset performance. These statements are based on current assumptions and are subject to risks and uncertainties; actual results may differ materially. Financialyst, Inc. assumes no obligation to update any information or opinions contained herein.
Copyright: © 2026 Financialyst, Inc. All Rights Reserved. This publication may not be reproduced, retransmitted, or distributed in any form without the prior written consent of Financialyst, Inc.