New Issue Note: BMO 2026-C14 Portfolio Concentrations Balanced by Conservative Structuring
Published on 2026-02-06
By Matt Anderson | LinkedIn
As the second conduit deal of 2026, BMO 2026-C14 is a 27-loan, $631.6 million transaction that exhibits greater concentration, balanced by conservative underwriting metrics, when compared to previous BMO deals. The conservative loan underwriting is also reflected in more conservative deal structuring, which has resulted in tighter pricing spreads for the offered bonds.
In the analysis below, we present analysis of the subject deal (BMO 2026-C14) as compared to the most recent three deals from the BMO shelf, all of which were issued in 2025 (February to September).
Asset Allocations – Greater Exposure to Retail and Office
Our analysis of the data tape shows that this deal has some shifts in property type and geographic concentrations, relative to the three previous BMO transactions.
-
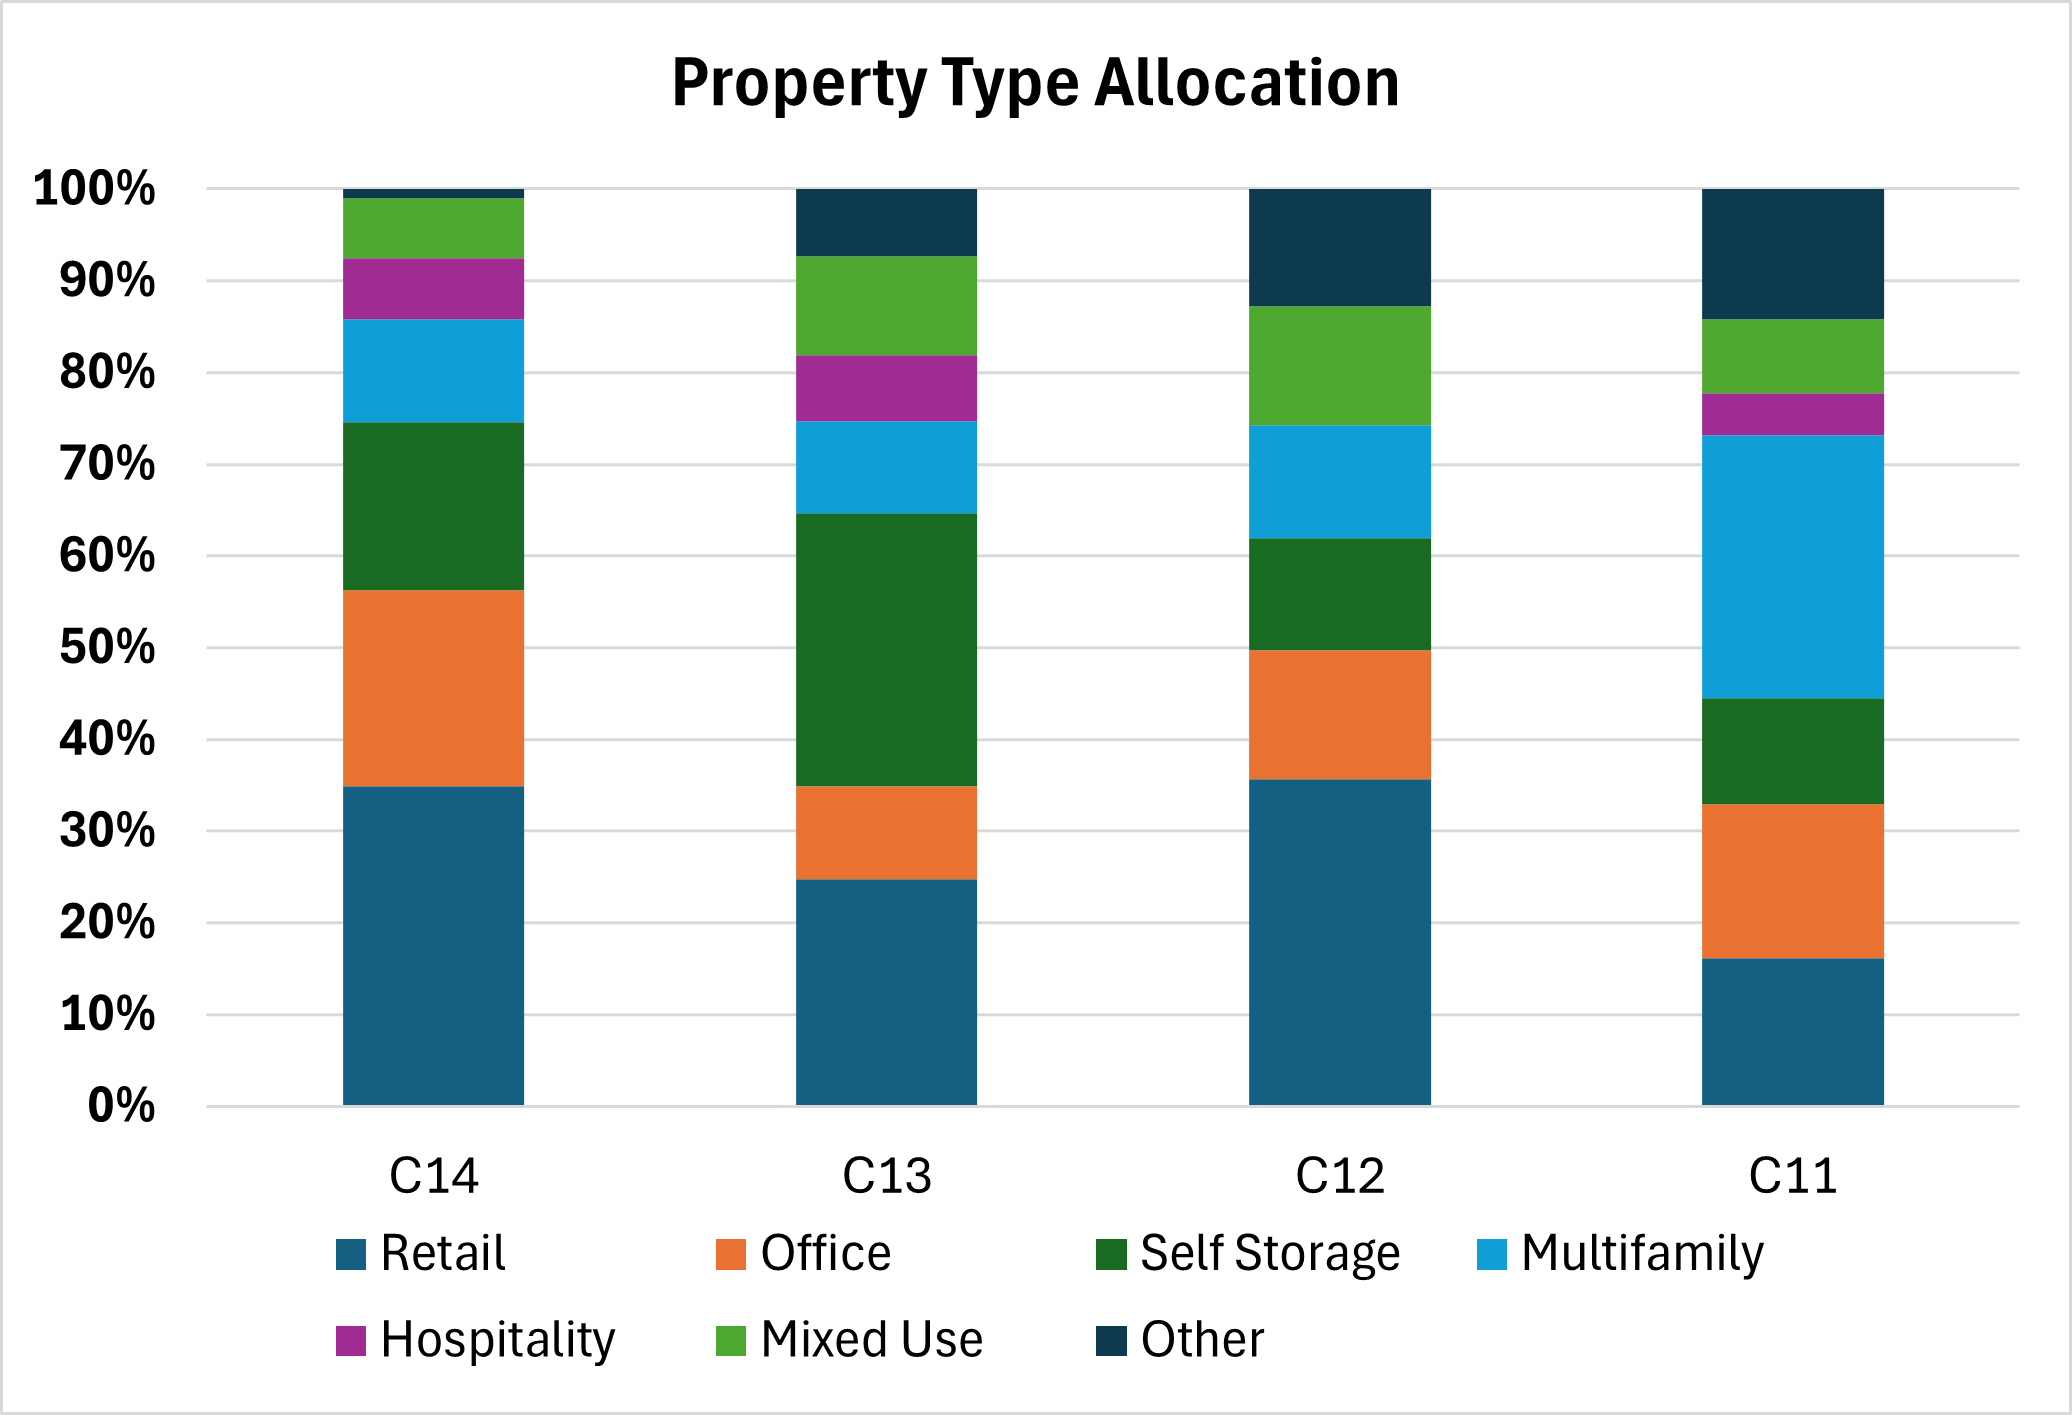
The portfolio has increased proportions of Retail (34.9%, up from an average of 25.5%) and Office (21.4%, up from an average of 13.7%). These two sectors account for 56.3% of the mortgage pool exposure.
-
The portfolio has shifted away from Multifamily (11.3% of the pool, down -5.7% from the previous average) and Mixed Use (6.5% of the pool, down -4.1% from the previous average).
-
The most notable geographic shift is a lower allocation to properties located in New York. New York still represents the largest single geographic concentration (15.8% of the portfolio), but is down by -13.3% relative to the average for the previous transactions.
-
The largest increases in geographic exposure occurred in Virginia (13.1%, up 13.0% from the previous average) and Michigan (10.2%, up 9.6%).
-
Smaller increases occurred in Florida (8.9%, up 4.4%) and Ohio (5.4%, up 4.3%).
Figure 1: Property Type Allocation
Comparative Credit Analysis: Benchmarking Against Recent BMO Deals
This deal exhibits greater concentration – a higher concentration in the top 10 loans and a lower effective loan count – which is offset by more conservative underwriting (lower LTVs and less full-term IO loans).
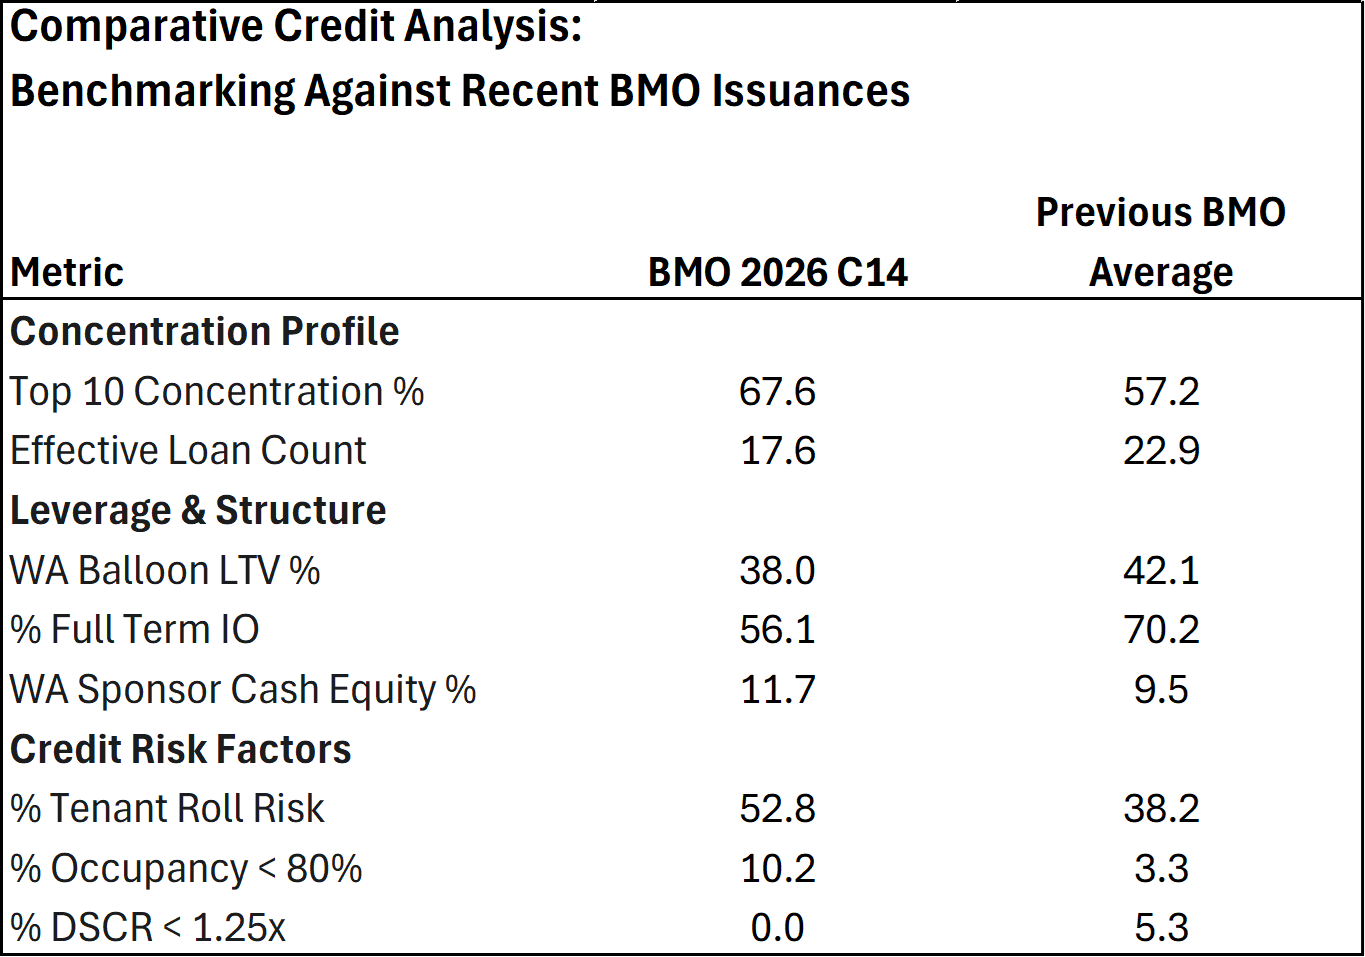
Figure 2: Comparative Credit Analysis
-
Diversification and Concentration Risk: This deal has a higher degree of concentration, with the top 10 loans accounting for 67.6% of the total mortgage pool, up from an average of 57.2% for the previous three BMO deals. The effective loan count has shrunk to 17.6, compared with an average of 22.9 for the previous transactions.
-
Tightening of Coverage Metrics: To compensate for the greater concentration, the coverage metrics reflect lower leverage and more conservative loan sizing. The weighted average balloon LTV has declined to 38.0% (down from 42.1% for the comparison deals). Correspondingly, there is less pure IO (56.1% for C14 vs. 70.2% for the previous 3 deals) and more sponsor cash equity going into the loans.
-
Credit Risk: Despite the more conservative leverage in the portfolio, there are some credit risk metrics that warrant a closer look.
-
This deal has a higher proportion of properties with occupancy rates below 80% (10.2% for C14 vs the average of 3.3% for the previous deals). Most of that is due to hotel exposure – the East Coast Hotel Portfolio, Loan #5 - where occupancy rates of 75% are typically considered strong. Other assets with sub-80% occupancy rates include Cummins Station (Loan #20 – see the “Rake” Feature discussion below), Kittle Storage (Loan #26, a $6.35 million loan comprising 1.0% of the deal total) and Vero Beach Kamp RV Park (Loan #27, a $6.3 million loan comprising 1.0% of the deal).
-
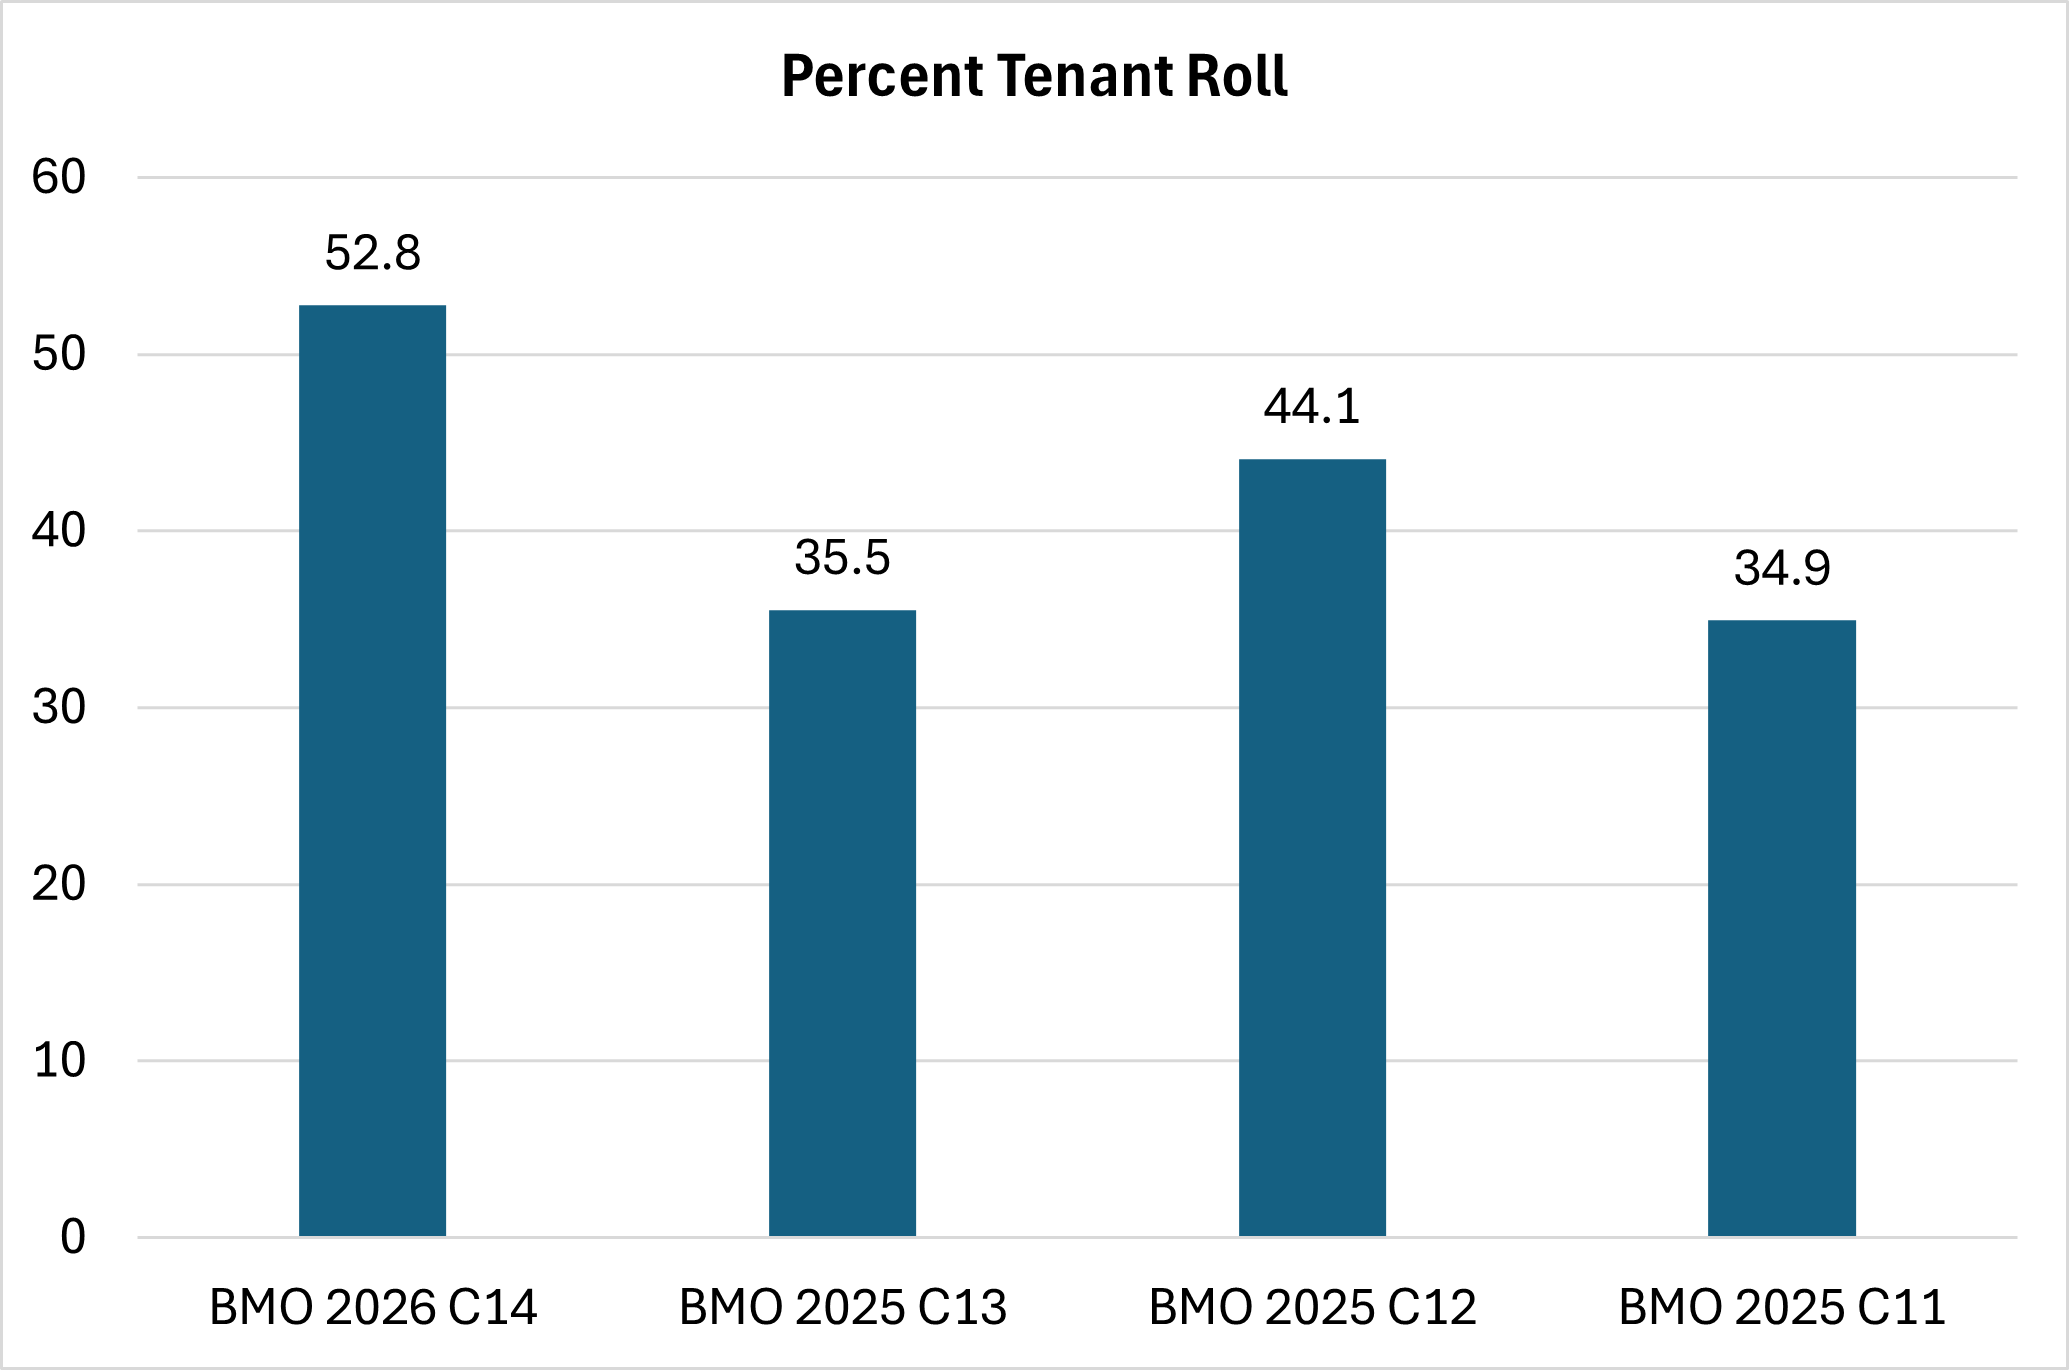
Tenant roll risk (the percentage of leases rolling before the loan maturity date) is higher in this deal than in the comparison group (52.8% vs 38.2%). Upon closer review, much of this stems from the government tenants at 255 Greenwich (Loan #8), with two leases that will expire before the loan matures (the DCAS lease expires in 2033, while the BMCC lease expires in 2035). Government tenants tend to be “sticky” with a high probability of renewal, so the higher tenant roll percentage for this deal is likely not as concerning as it would initially appear.
-
Corresponding with the conservative leverage in the mortgage pool, this deal features comparatively stronger DSCRs. None of the loans have an initial DSCR of less than 1.25.
-
Figure 3: Tenant Roll
Bond Structuring: Extra Credit Enhancement Pays Off with Tighter Spreads
The risks presented by greater concentration in the loan portfolio – with more reliance on the top 10 loans and a greater exposure to the retail and office property types – have been offset by increased credit support for the investment-grade tranches. And the extra credit support has paid off in the form of tighter spreads.
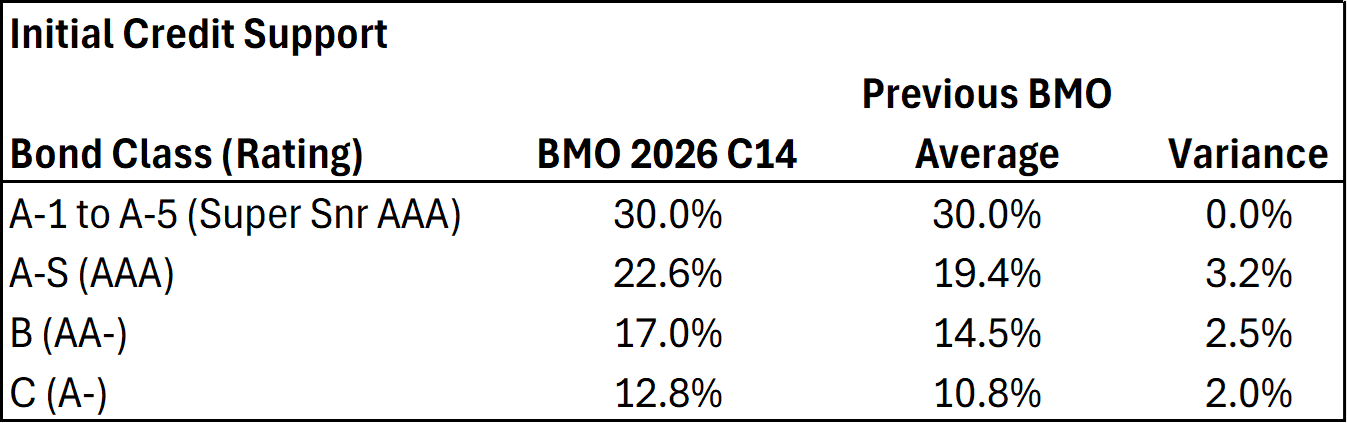
- Credit Support: The investment grade tranches from A to non-super senior AAA feature greater credit enhancement relative to the three previous BMO deals. The credit enhancement for the A-S (AAA), B (AA-) and C (A-) tranches is higher than the previous deals by 2.0% to 3.2%, giving each of these bonds a greater cushion against potential losses.
Figure 4: Initial Credit Support
-
Tighter Spreads: The market has rewarded this deal’s greater credit support with tighter spreads.
-
The super-senior A-5 bond priced at J+75, tighter by an average of 14 basis points relative to the three previous BMO deals.
-
The A-S bond (AAA) priced at J+95, a 20-35 basis point improvement from the previous deals.
-
The B class bond (AA-) priced at J+125, 25-35 basis points tighter than the comparison set.
-
-
The “Rake” Feature (Class A-2-CS): This deal features a less typical bond, structured specifically to isolate the cash flows of Cummins Station (Loan #20), a $10 million loan secured by a Nashville office property with transitional occupancy (70.6%) and a shorter 5-year term. By "raking" this asset out of the general pool, BMO protected the primary 10-year bondholders from the loan's maturity and lease-up risks. Consequently, despite sharing the same "fortress" 30% credit enhancement and AAA rating as the super-senior classes, investors required a J+120 spread - roughly 45 basis points wider than the diversified pool - to hold this concentrated single-asset exposure.
Conclusion
BMO 2026-C14 represents a "barbell" strategy that trades higher asset concentration for defensive structuring. While the portfolio has increased exposure to less-favored asset classes - with the highest Retail and Office exposure in the recent series - it insulates investors from these sector headwinds through the lowest leverage point (38.0% LTV vs. 41.1%) and highest amortization schedule (56.1% full-term IO vs. 70.2%) of any recent BMO conduit.
This structural conservatism is reinforced by the bond stack itself, which features a 30% credit enhancement for the super-senior AAA bonds and a unique rake structure to isolate specific transitional assets. The tighter pricing across the stack confirms that the market has validated this approach: investors are willing to accept concentrated exposure to strong sponsors (Simon, Blackstone, U-Haul) when wrapped in a highly defensive, over-equitized capital structure.
Please contact Financialyst with questions, including further commentary on assets and structuring.
Important Disclaimers & Disclosures
Nature of Content: This publication is for informational purposes only and is intended solely for sophisticated institutional investors. The content herein, including credit analyses, relative value assessments, and structural reviews, constitutes statements of opinion as of the date of publication and not statements of fact regarding creditworthiness or investment potential. Nothing contained in this report constitutes investment advice, a recommendation, or an offer to sell or a solicitation of an offer to buy any securities. This report does not take into account the particular investment objectives, financial situations, or needs of individual investors.
Data Integrity & Sources: The data and information contained herein are derived from the Preliminary Prospectus and other sources believed by Financialyst, Inc. to be reliable. However, Financialyst, Inc. has not performed an independent audit or verification of the underlying collateral data (including Annex A data tapes). This information is provided on an "as-is" basis and is subject to amendment or supplementation. Financialyst, Inc. makes no representation or warranty, express or implied, regarding the accuracy, timeliness, completeness, merchantability, or fitness for a particular purpose of any such information.
Limitation of Liability: Financialyst, Inc. and its directors, officers, employees, and agents specifically disclaim any and all liability for any errors, omissions, or delays in the data or analysis, or for any actions taken in reliance thereon. In no event shall Financialyst, Inc. be liable for any direct, indirect, incidental, special, or consequential damages arising out of the use of, or inability to use, this report or the information contained herein, even if advised of the possibility of such damages.
Forward-Looking Statements: This report may contain forward-looking statements regarding future market conditions, lease expirations, or asset performance. These statements are based on current assumptions and are subject to risks and uncertainties; actual results may differ materially. Financialyst, Inc. assumes no obligation to update any information or opinions contained herein.
Copyright: © 2026 Financialyst, Inc. All Rights Reserved. This publication may not be reproduced, retransmitted, or distributed in any form without the prior written consent of Financialyst, Inc.