New Issue Note: BBCMS 2026-5C40 Portfolio Diversity and Stronger Credit
Published on 2026-01-22
By Matt Anderson | LinkedIn
As the first conduit deal of 2026, BBCMS 2026-5C40 is an $834.4 million transaction that marks a notable departure from recent issuance patterns. The deal exhibits greater collateral diversity and stronger credit metrics compared to other recent BBCMS securitizations. However, this enhancement comes with reduced structural control rights that could warrant investor consideration, especially of the lower-rated tranches.
In the analysis below, we present analysis of the subject deal (BBCMS 2026-5C40) as compared to the most recent five deals from the BBCMS shelf, all of which were issued in the second half of 2025.
Asset Allocations – More Hospitality, Less Retail
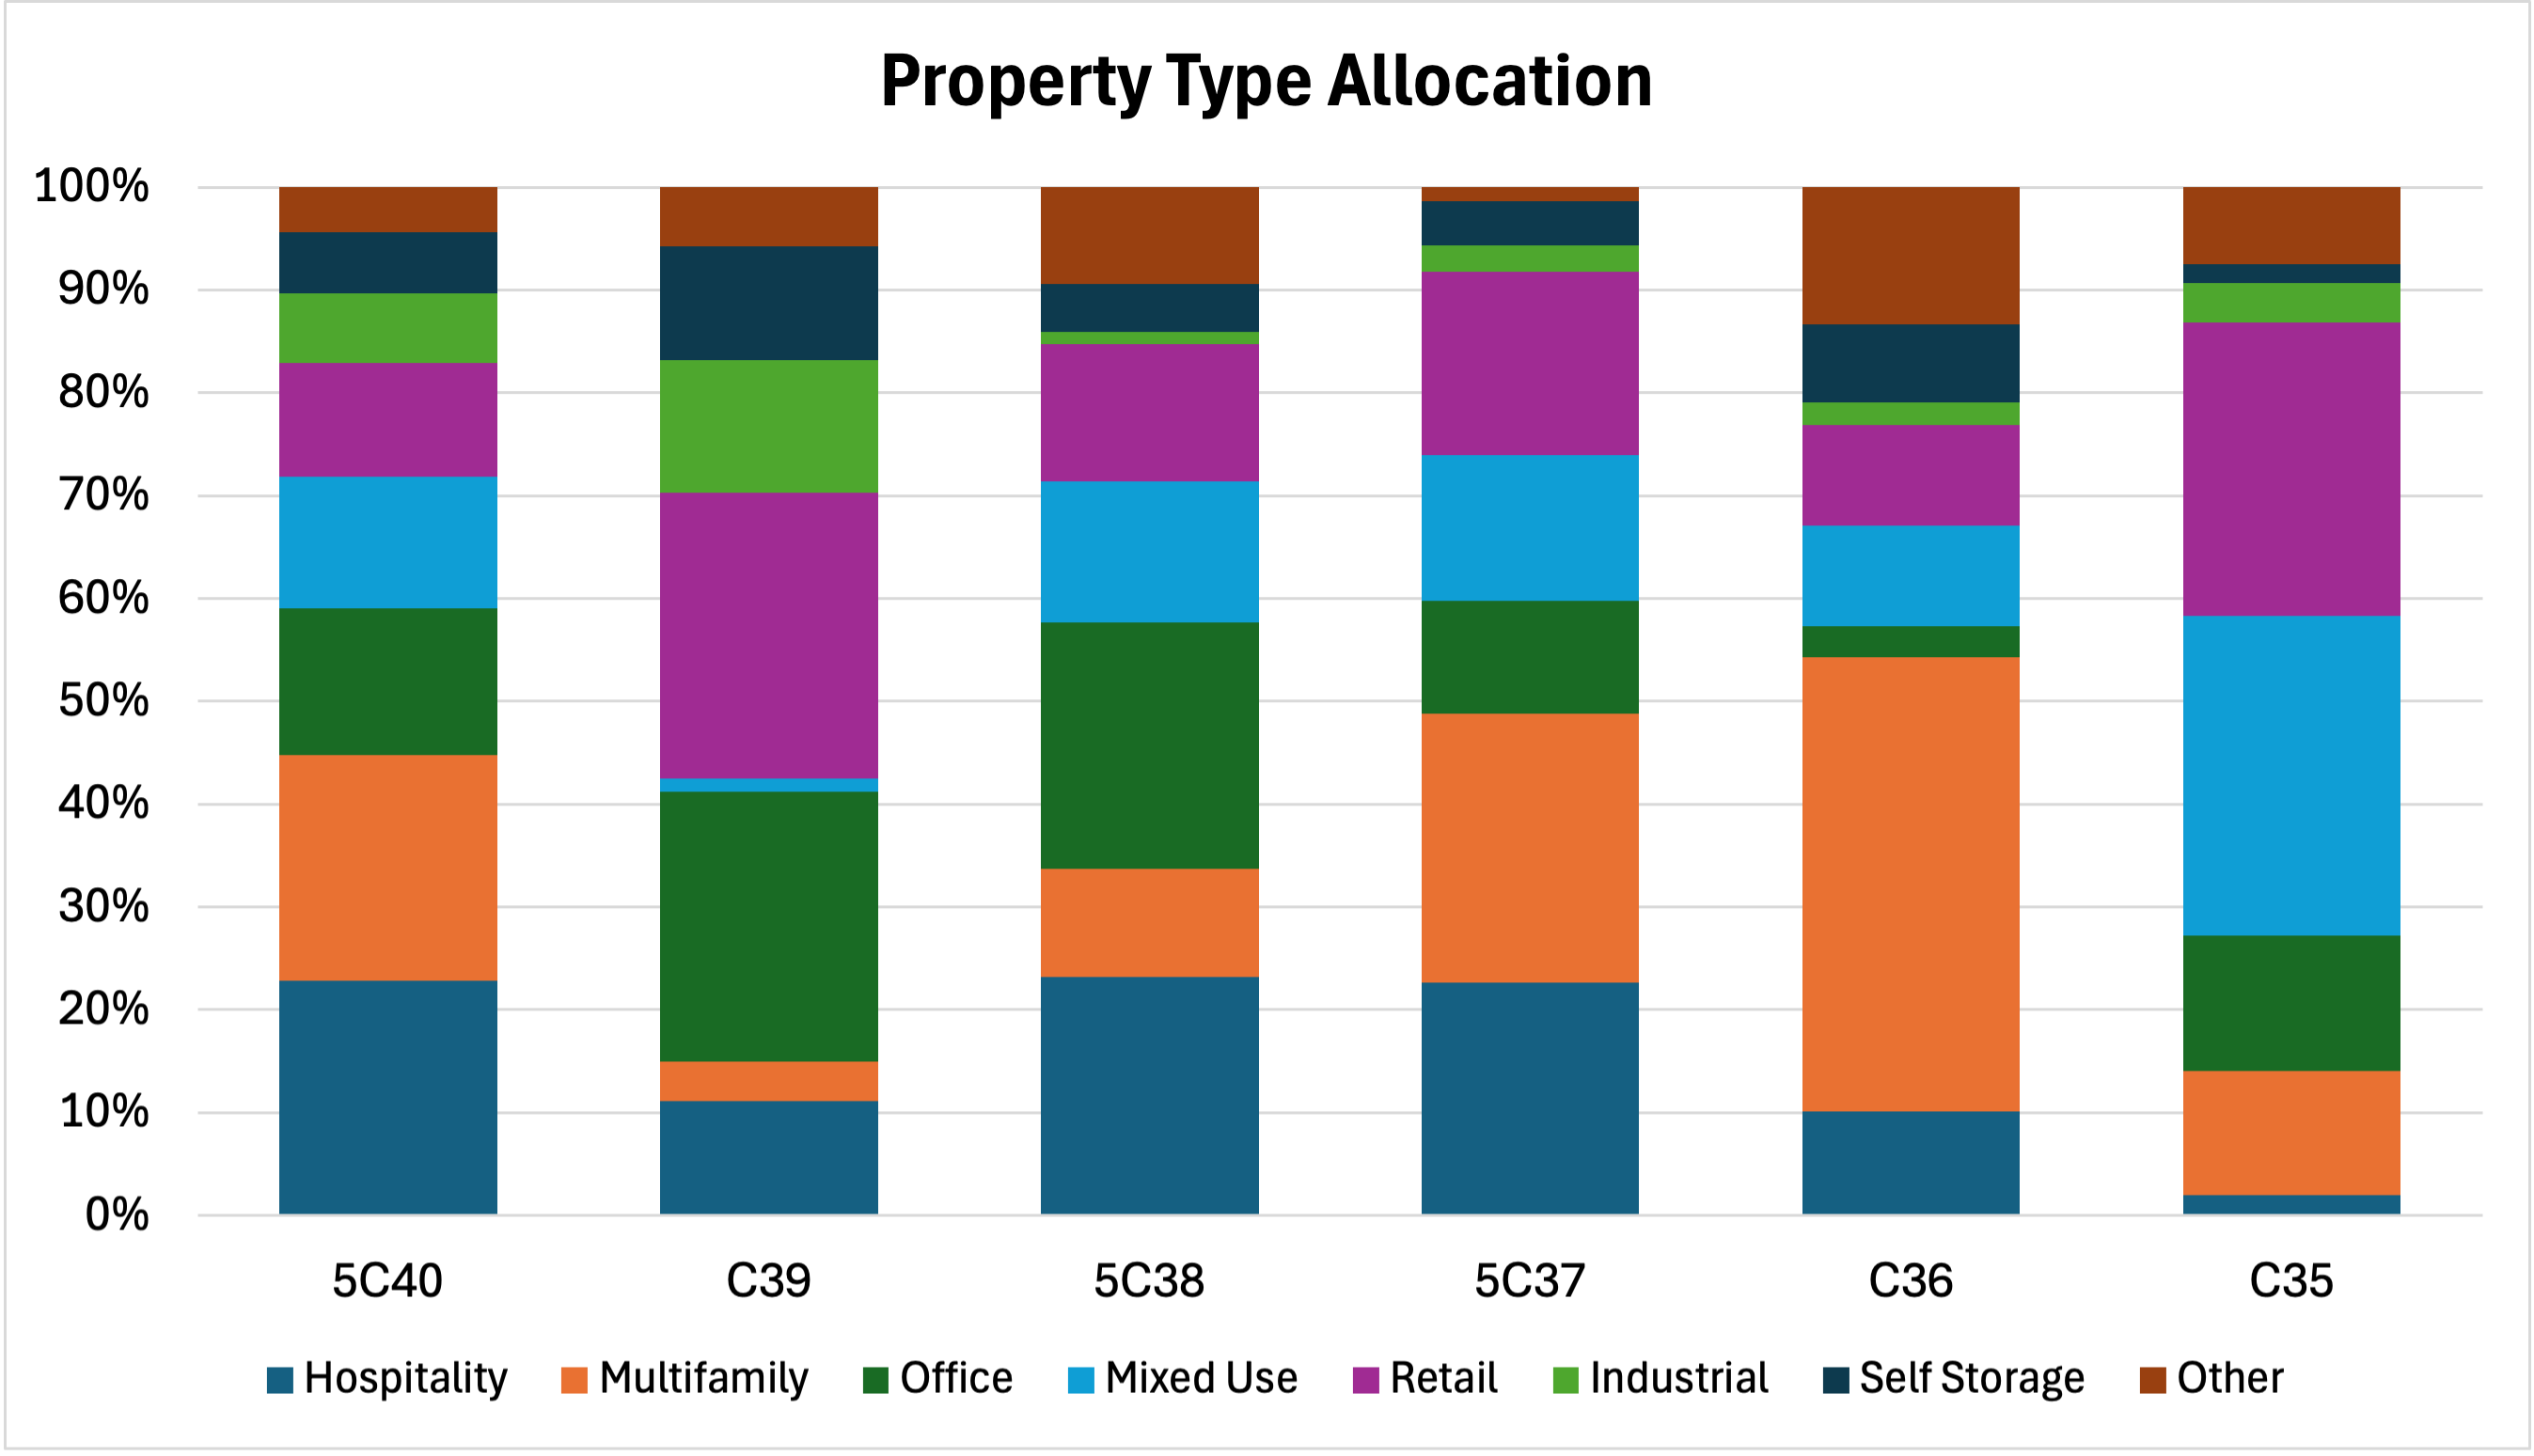
Our analysis of the data tape shows that this deal has overall greater balance across property sectors than the previous deals.
- The portfolio exhibits a pivot away from the Retail sector (11.1% of the pool) toward Hospitality assets, which now comprise 22.8% of the pool.
- Smaller relative shifts have occurred away from Office (-1.1% vs the previous average) and Mixed-Use (-1.3%) and toward Multifamily (+2.6%) and Industrial (+2.2%).
- Geographic shifts have occurred as well. The top two states in the portfolio are California (22.9%) and New York (14.6%). The concentration in California is up by 9.9% compared to the 13.0% average in the previous five BBCMS deals, while New York’s share is down by 10.9% from the 25.5% average in the previous deals.
- Nevada ranks 3rd among states (9.0%), up by 8.4% compared to the 0.6% average among the prior five BBCMS transactions. The largest loan in this transaction is a $75 million piece of a $3.45 billion loan for the CityCenter property, a large mixed-use development comprising the Aria Resort & Casino and the neighboring Vdara Hotel & Spa in Las Vegas.
Comparative Credit Analysis: Benchmarking Against Recent BBCMS Issuances
| Metric | BBCMS 2026-5C40 | Recent BBCMS Average (C35-C39) |
|---|---|---|
| Effective Loan Count | 26.3 | 19.6 |
| Top 10 Concentration | 49.8 | 62.5 |
| Sponsor Cash Equity (WA) | 11.1 | 6.2 |
| Pool DSCR < 1.25x | 1.6 | 6.8 |
| Pre-Maturity Lease Roll | 11.2 | 24.1 |
| Pct Non-Controlling Positions | 24.8 | 16.1 |
Source: Deal prospectus and comparative shelf analysis
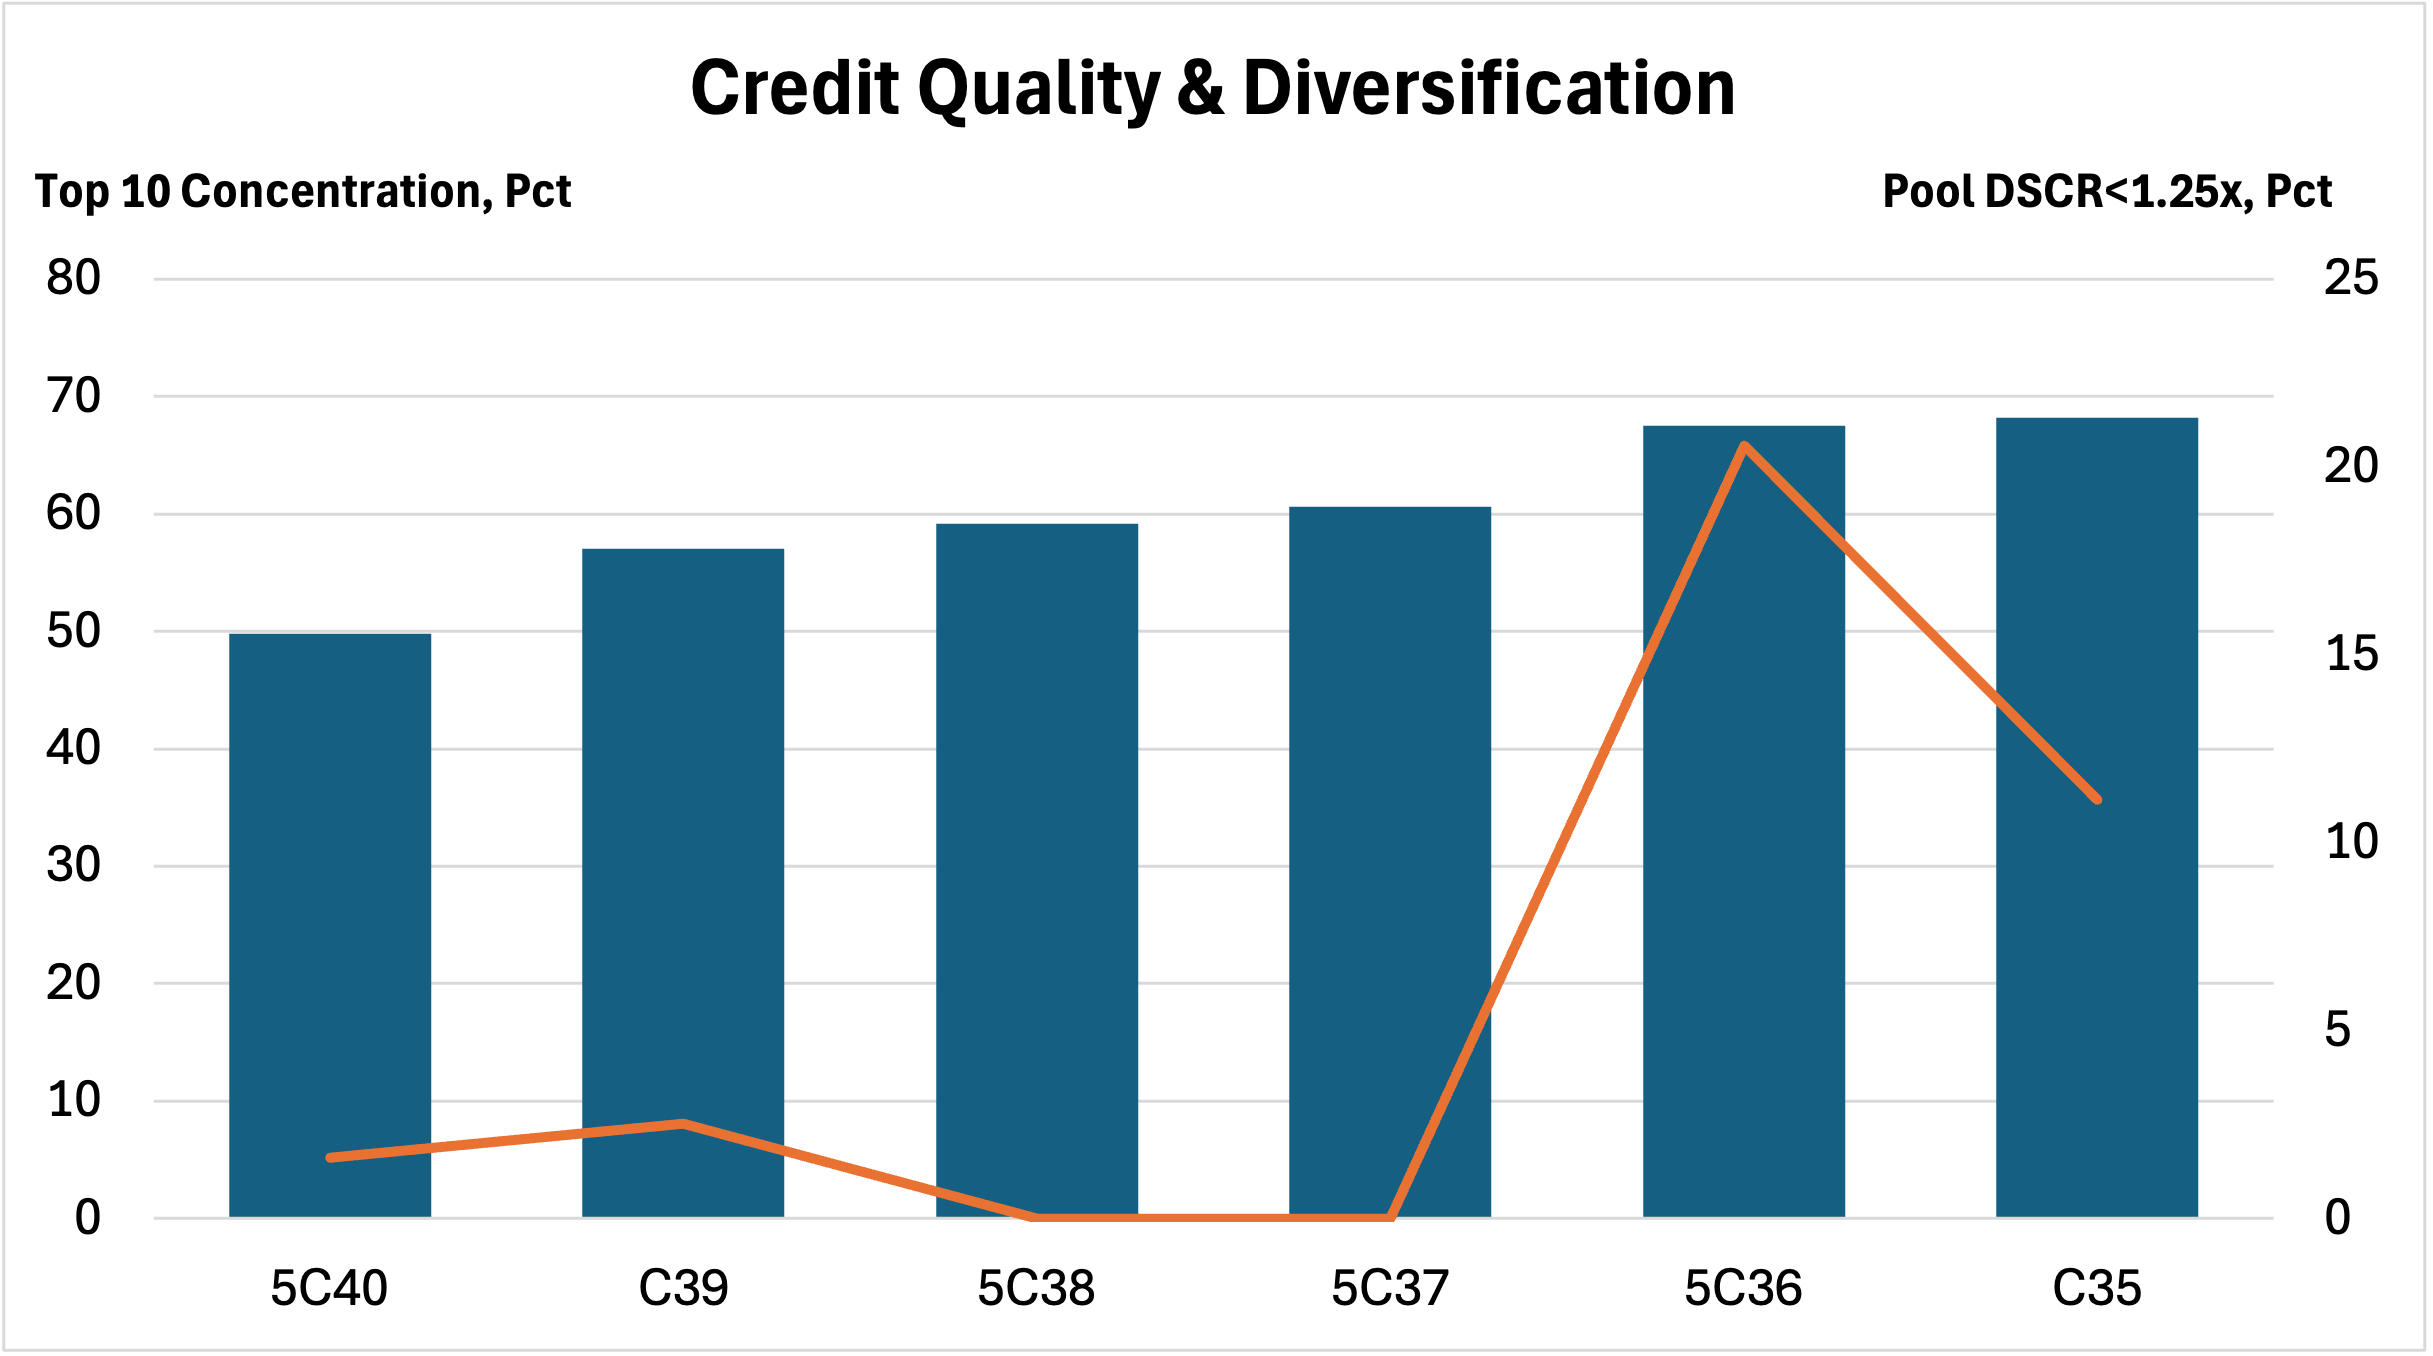
As with the shift to a more evenly distributed property type allocation, our review of portfolio credit metrics indicates that the subject transaction represents a move to a more diversified portfolio, with stronger credit metrics when compared to recent BBCMS deals.
- Diversification and Concentration Risk: The effective loan count has expanded to 26.3, a marked improvement from the 19.6 average for the other recent BBCMS securitizations. Concurrently, the aggregate balance of the top ten loans has contracted to 49.8% of the pool. This is the only issuance in the recent cohort to remain below the 50% concentration threshold.
- Strengthening of Coverage Metrics: The proportion of the collateral pool exhibiting a Debt Service Coverage Ratio (DSCR) below 1.25x is a very low 1.62%. This stands in contrast to Transaction C36, where over 20% of the collateral carried constrained debt service coverage, exposing bondholders to elevated risk from cash flow disruptions.
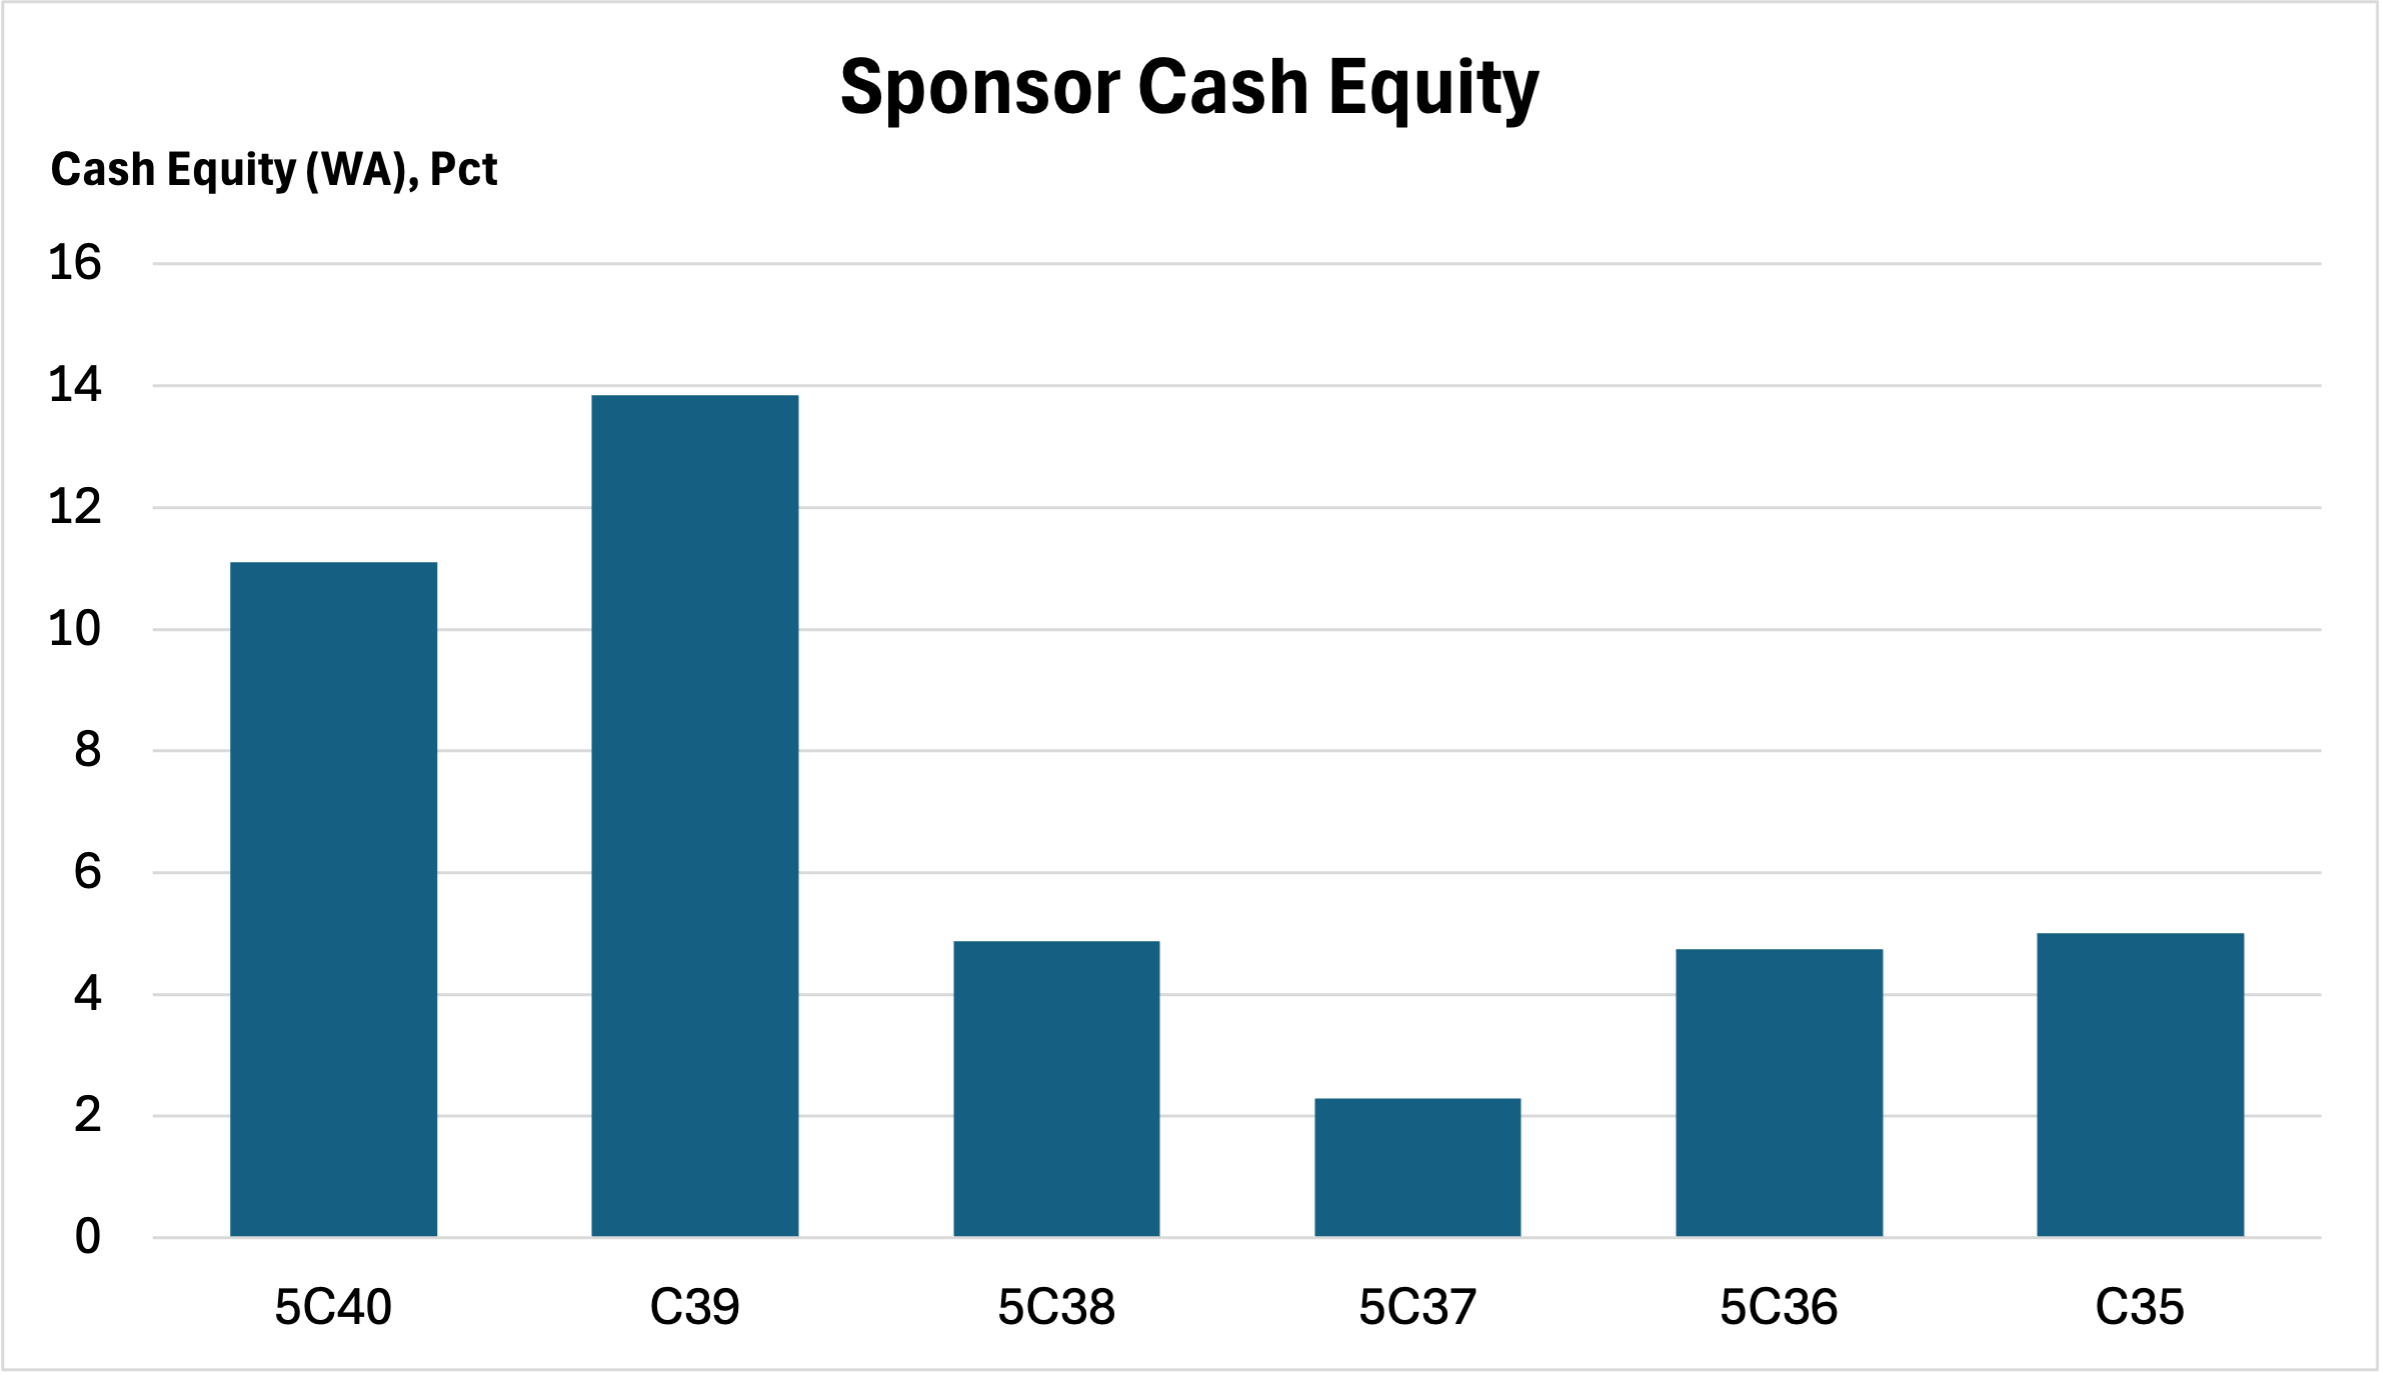
- Sponsor De-leveraging: The subject transaction evidences a weighted average sponsor cash equity contribution of 11.1%, well above the 6.2% average for the previous deals. This injection of fresh capital to retire existing debt signals a robust sponsor commitment to the assets and provides a material equity cushion against valuation compression.
- Lease Rollover Exposure: Only 11.2% of the pool faces a major tenant lease expiration prior to loan maturity. This represents a significant reduction in leasing execution risk compared to the C39 and C35 transactions, which exhibited rollover exposures ranging from 43% to 48%.
Governance Structure: Control and Alignment
This transaction features somewhat lower control over the assets in the case of distress/default, while the L-shaped risk retention should foster greater alignment across the different tranches in the deal.
- Active vs. Passive Governance: Our analysis of the pari passu capital structures shows that non-controlling note positions comprise 24.8% of the pool balance. That is noticeably higher than the 16.1% average across the previous deals.
- The "Blind Exposure" Arbitrage: We note a structural asymmetry where the non-controlling interest of 24.8% exceeds the thickness of the subordinate B-Piece of approximately 9.25%. While this implies the junior bondholders are exposed to first losses on assets they cannot control, this risk is mitigated by the specific credit profile of the non-controlling assets. The non-controlling component is dominated by low-leverage institutional assets (e.g., CityCenter at 36.2% LTV), whereas the trust retains control over the higher-beta assets (transitional office and retail) where active workout expertise is requisite.
- L-Shaped Risk Retention: The capital structure utilizes an "L-Shaped" risk retention compliance strategy, which provides superior alignment compared to pure horizontal or vertical structures. The Sponsor (Argentic) is retaining a vertical strip of approximately 2.91% of every certificate class, alongside a horizontal first-loss interest via the F-RR and G-RR classes. This mandates that the Directing Certificate holder actively participate in the credit risk of the entire capital stack, from super-senior AAA down to the first-loss equity, for the statutory holding period.
Relative Value Analysis: The Class A-S Tranche
For investors mandating investment-grade ratings, the Class A-S certificates might present a pricing dislocation driven by rating agency methodology divergences.
- Rating Bifurcation: The Class A-S tranche carries AAA ratings from Fitch and KBRA but has been assigned an AA- rating by S&P. This divergence could be attributable to S&P’s model treatment of the pool’s elevated hospitality concentration (22.8%).
- Credit Enhancement: With an attachment point of 49.5% LTV and a Debt Yield of 15.8%, the credit metrics of this tranche are consistent with senior AAA profiles. Investors may therefore capture a yield premium associated with the AA- designation while holding risk that is quantitatively aligned with super-senior collateral.
Conclusion
The transaction offers a diversified and cleaner pool, with minimized exposure to marginal credits (1.6% of pool) and substantial sponsor alignment (11.1% cash equity), effectively addressing the leverage concerns prevalent in late-2025 vintages.
While the non-controlling interest component has expanded to 24.8%, creating a structural asymmetry relative to the subordinate class thickness, this risk is counterbalanced by the "L-Shaped" risk retention structure. This alignment mechanism helps ensure that the Directing Certificate holder retains an economic exposure across the entire capital stack, limiting the agency risks typically associated with conduit governance.
For investors, the split-rated Class A-S tranche could present a relative value opportunity, offering potential yield premiums derived from rating model divergences rather than fundamental credit deterioration.
Please contact Financialyst with questions, including further commentary on assets and structuring.
Important Disclaimers & Disclosures
Nature of Content: This publication is for informational purposes only and is intended solely for sophisticated institutional investors. The content herein, including credit analyses, relative value assessments, and structural reviews, constitutes statements of opinion as of the date of publication and not statements of fact regarding creditworthiness or investment potential. Nothing contained in this report constitutes investment advice, a recommendation, or an offer to sell or a solicitation of an offer to buy any securities. This report does not take into account the particular investment objectives, financial situations, or needs of individual investors.
Data Integrity & Sources: The data and information contained herein are derived from the Preliminary Prospectus and other sources believed by Financialyst, Inc. to be reliable. However, Financialyst, Inc. has not performed an independent audit or verification of the underlying collateral data (including Annex A data tapes). This information is provided on an "as-is" basis and is subject to amendment or supplementation. Financialyst, Inc. makes no representation or warranty, express or implied, regarding the accuracy, timeliness, completeness, merchantability, or fitness for a particular purpose of any such information.
Limitation of Liability: Financialyst, Inc. and its directors, officers, employees, and agents specifically disclaim any and all liability for any errors, omissions, or delays in the data or analysis, or for any actions taken in reliance thereon. In no event shall Financialyst, Inc. be liable for any direct, indirect, incidental, special, or consequential damages arising out of the use of, or inability to use, this report or the information contained herein, even if advised of the possibility of such damages.
Forward-Looking Statements: This report may contain forward-looking statements regarding future market conditions, lease expirations, or asset performance. These statements are based on current assumptions and are subject to risks and uncertainties; actual results may differ materially. Financialyst, Inc. assumes no obligation to update any information or opinions contained herein.
Copyright: © 2026 Financialyst, Inc. All Rights Reserved. This publication may not be reproduced, retransmitted, or distributed in any form without the prior written consent of Financialyst, Inc.